
Page 184 - Vibrational Spectroscopic Imaging for Biomedical Applications
P. 184
160 Cha pte r S i x
time, Schaeberle and coworkers claimed that the LCTF is the only
demonstrated technology for simultaneously providing high-spatial
36
and spectral resolution. Indeed LCTF-driven widefield imaging has
continued to progress in the Raman field.
In general, liquid crystal devices provide diffraction-limited spa-
tial resolution. The spectral resolution of LCTFs is comparable to that
provided by a single stage dispersive monochromator. In addition,
liquid crystal technology provides high out-of-band rejection, a
broad, free spectral range, a moderate transmittance and throughput,
and computer-controlled tuning. 37
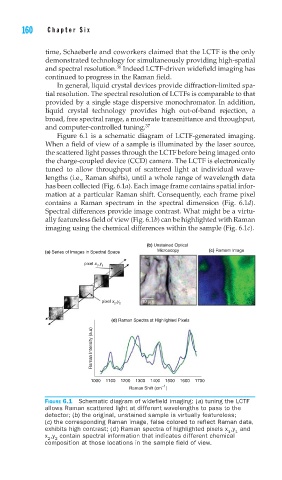
Figure 6.1 is a schematic diagram of LCTF-generated imaging.
When a field of view of a sample is illuminated by the laser source,
the scattered light passes through the LCTF before being imaged onto
the charge-coupled device (CCD) camera. The LCTF is electronically
tuned to allow throughput of scattered light at individual wave-
lengths (i.e., Raman shifts), until a whole range of wavelength data
has been collected (Fig. 6.1a). Each image frame contains spatial infor-
mation at a particular Raman shift. Consequently, each frame pixel
contains a Raman spectrum in the spectral dimension (Fig. 6.1d).
Spectral differences provide image contrast. What might be a virtu-
ally featureless field of view (Fig. 6.1b) can be highlighted with Raman
imaging using the chemical differences within the sample (Fig. 6.1c).
(b) Unstained Optical
Microscopy (c) Ramam Image
(a) Series of Images in Spectral Space
pixel x ,y
1 1
pixel x ,y 10 μm
2 2
(d) Raman Spectra at Highlighted Pixels
Raman Intensity (a.u)
1000 1100 1200 1300 1400 1500 1600 1700
–1
Raman Shift (cm )
FIGURE 6.1 Schematic diagram of widefield imaging: (a) tuning the LCTF
allows Raman scattered light at different wavelengths to pass to the
detector; (b) the original, unstained sample is virtually featureless;
(c) the corresponding Raman image, false colored to reflect Raman data,
exhibits high contrast; (d ) Raman spectra of highlighted pixels x ,y and
1 1
x ,y contain spectral information that indicates different chemical
2
2
composition at those locations in the sample field of view.