
Page 189 - Vibrational Spectroscopic Imaging for Biomedical Applications
P. 189
W idefield Raman Imaging of Cells and T issues 165
38000
36000
34000
32000
30000
28000
26000
24000
Intensity (a.u) 20000
22000
18000
16000
14000
12000
10000
8000
6000
4000
2000
0
–400 0 400 800 1200 1600 2000 2400 2800 3200 3600 4000
–1
Raman Shift (cm )
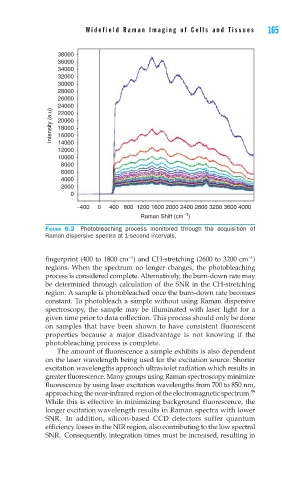
FIGURE 6.2 Photobleaching process monitored through the acquisition of
Raman dispersive spectra at 1-second intervals.
-1
-1
fingerprint (400 to 1800 cm ) and CH-stretching (2600 to 3200 cm )
regions. When the spectrum no longer changes, the photobleaching
process is considered complete. Alternatively, the burn-down rate may
be determined through calculation of the SNR in the CH-stretching
region. A sample is photobleached once the burn-down rate becomes
constant. To photobleach a sample without using Raman dispersive
spectroscopy, the sample may be illuminated with laser light for a
given time prior to data collection. This process should only be done
on samples that have been shown to have consistent fluorescent
properties because a major disadvantage is not knowing if the
photobleaching process is complete.
The amount of fluorescence a sample exhibits is also dependent
on the laser wavelength being used for the excitation source. Shorter
excitation wavelengths approach ultraviolet radiation which results in
greater fluorescence. Many groups using Raman spectroscopy minimize
fluorescence by using laser excitation wavelengths from 700 to 850 nm,
approaching the near-infrared region of the electromagnetic spectrum. 59
While this is effective in minimizing background fluorescence, the
longer excitation wavelength results in Raman spectra with lower
SNR. In addition, silicon-based CCD detectors suffer quantum
efficiency losses in the NIR region, also contributing to the low spectral
SNR. Consequently, integration times must be increased, resulting in