
Page 192 - Vibrational Spectroscopic Imaging for Biomedical Applications
P. 192
168 Cha pte r S i x
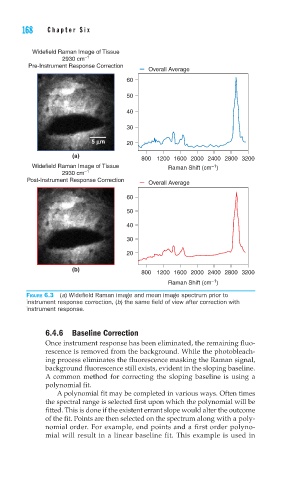
Widefield Raman Image of Tissue
2930 cm –1
Pre-Instrument Response Correction
Overall Average
60
50
40
30
5 lm 20
(a)
800 1200 1600 2000 2400 2800 3200
Widefield Raman Image of Tissue Raman Shift (cm )
–1
2930 cm –1
Post-Instrument Response Correction
Overall Average
60
50
40
30
20
(b)
800 1200 1600 2000 2400 2800 3200
–1
Raman Shift (cm )
FIGURE 6.3 (a) Widefi eld Raman image and mean image spectrum prior to
instrument response correction, (b) the same fi eld of view after correction with
instrument response.
6.4.6 Baseline Correction
Once instrument response has been eliminated, the remaining fluo-
rescence is removed from the background. While the photobleach-
ing process eliminates the fluorescence masking the Raman signal,
background fluorescence still exists, evident in the sloping baseline.
A common method for correcting the sloping baseline is using a
polynomial fit.
A polynomial fit may be completed in various ways. Often times
the spectral range is selected first upon which the polynomial will be
fitted. This is done if the existent errant slope would alter the outcome
of the fit. Points are then selected on the spectrum along with a poly-
nomial order. For example, end points and a first order polyno-
mial will result in a linear baseline fit. This example is used in