
Page 196 - Vibrational Spectroscopic Imaging for Biomedical Applications
P. 196
172 Cha pte r S i x
determined, the second PC is plotted in the same way to capture
more variance, but it must be orthogonal to the first PC. This pro-
cess is continued, where each additional PC must be orthogonal to
the other PCs, until all of the variance is adequately described. This
reduces the data into a new coordinate system based on the variance.
Once the data is reduced into this new coordinate system, one can
visualize the data by plotting different PC scores. The coordinates of
data points relative to the PC axes are termed scores. One can plot
points from the data along different axes within the PC coordinate
system. The resulting plots are called scatter plots. The data points
within the scatter plot represent the spectra and will cluster in PC
space (coordinate system based on PCs) according to similarities in
spectral characteristics.
The spectra obtained from widefield Raman images and analyzed
using PCA will have been preprocessed according to the steps out-
lined in the previous section. It is important that all of the data is
processed consistently so as to prevent an artifact of variance being
introduced to the data from different processing steps. In addition,
regions of the spectra where differences are seen can be analyzed
without having to evaluate the entire spectrum.
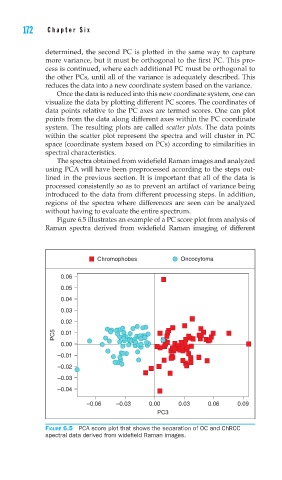
Figure 6.5 illustrates an example of a PC score plot from analysis of
Raman spectra derived from widefield Raman imaging of different
Chromophobes Oncocytoma
0.06
0.05
0.04
0.03
0.02
PC5 0.01
0.00
–0.01
–0.02
–0.03
–0.04
–0.06 –0.03 0.00 0.03 0.06 0.09
PC3
FIGURE 6.5 PCA score plot that shows the separation of OC and ChRCC
spectral data derived from widefi eld Raman images.