
Page 200 - Vibrational Spectroscopic Imaging for Biomedical Applications
P. 200
176 Cha pte r S i x
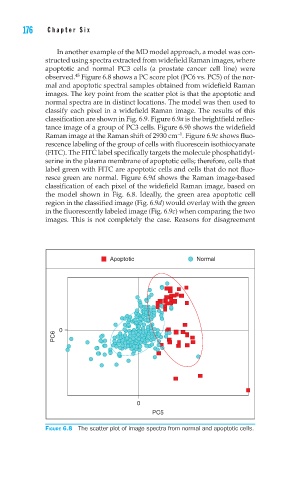
In another example of the MD model approach, a model was con-
structed using spectra extracted from widefield Raman images, where
apoptotic and normal PC3 cells (a prostate cancer cell line) were
45
observed. Figure 6.8 shows a PC score plot (PC6 vs. PC5) of the nor-
mal and apoptotic spectral samples obtained from widefield Raman
images. The key point from the scatter plot is that the apoptotic and
normal spectra are in distinct locations. The model was then used to
classify each pixel in a widefield Raman image. The results of this
classification are shown in Fig. 6.9. Figure 6.9a is the brightfield reflec-
tance image of a group of PC3 cells. Figure 6.9b shows the widefield
-1
Raman image at the Raman shift of 2930 cm . Figure 6.9c shows fluo-
rescence labeling of the group of cells with fluorescein isothiocyanate
(FITC). The FITC label specifically targets the molecule phosphatidyl-
serine in the plasma membrane of apoptotic cells; therefore, cells that
label green with FITC are apoptotic cells and cells that do not fluo-
resce green are normal. Figure 6.9d shows the Raman image-based
classification of each pixel of the widefield Raman image, based on
the model shown in Fig. 6.8. Ideally, the green area apoptotic cell
region in the classified image (Fig. 6.9d) would overlay with the green
in the fluorescently labeled image (Fig. 6.9c) when comparing the two
images. This is not completely the case. Reasons for disagreement
Apoptotic Normal
PC6 0
0
PC5
FIGURE 6.8 The scatter plot of image spectra from normal and apoptotic cells.