
Page 202 - Vibrational Spectroscopic Imaging for Biomedical Applications
P. 202
178 Cha pte r S i x
6.5.3 Spectral Mixture Resolution
As described in the previous section, PCA and MD can be used to
create a classification model and classify every pixel within an image.
Another method to classify every pixel in an image is the technique
of spectral mixture resolution (SMR). SMR uses a set of user-specified
reference spectra to find the best linear combination of reference
spectra for each pixel in a given spectral image.
The SMR function results in the output of two images: (1) a concen-
tration image with one frame for each spectrum in the reference set and
(2) a residual image. The concentration image essentially maps the dis-
tribution of reference spectral species in the active image. There will be
one concentration map for each reference spectrum. The concentration
values for a given frame can vary between 0 and 1, and the set of con-
centration values for a given pixel (over all frames) sum to 1. A least-
squares fit is used with the stipulation that no concentrations can be
negative. The residual image contains the spectral information not
explained by the reference spectra. If the imaged sample contains only
the substances represented by the reference spectra, an average spec-
trum of the residual image should represent only noise, and have very
small intensities compared to an average spectrum of the original
image. If there are chemical species present in the sample that are not
represented by the set of reference spectra, the residual image should
contain spectra that represent the mixture of chemical species remain-
ing after the set of reference spectra has been subtracted.
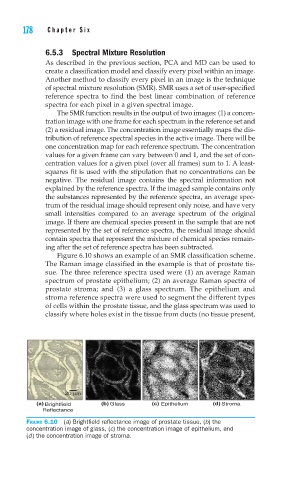
Figure 6.10 shows an example of an SMR classification scheme.
The Raman image classified in the example is that of prostate tis-
sue. The three reference spectra used were (1) an average Raman
spectrum of prostate epithelium; (2) an average Raman spectra of
prostate stroma; and (3) a glass spectrum. The epithelium and
stroma reference spectra were used to segment the different types
of cells within the prostate tissue, and the glass spectrum was used to
classify where holes exist in the tissue from ducts (no tissue present,
20 μm
(a) Brightfield (b) Glass (c) Epithelium (d) Stroma
Reflectance
FIGURE 6.10 (a) Brightfi eld refl ectance image of prostate tissue, (b) the
concentration image of glass, (c) the concentration image of epithelium, and
(d) the concentration image of stroma.