
Page 201 - Vibrational Spectroscopic Imaging for Biomedical Applications
P. 201
W idefield Raman Imaging of Cells and T issues 177
Widefield Raman Image Fluorescence
Brightfield Reflectance 2930 cm –1 FITC Label Classified Image
20 μm
20 μm 20 μm
20 μm
D
(a) (b) (c) (d)
Background
Apoptotic Cell
Normal Cell
−1
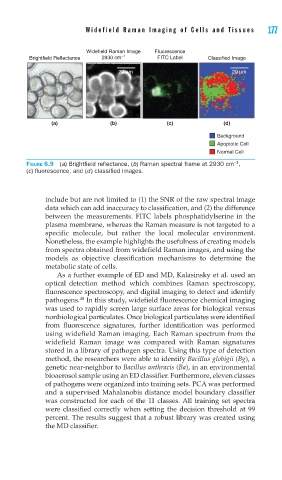
FIGURE 6.9 (a) Brightfi eld refl ectance, (b) Raman spectral frame at 2930 cm ,
(c) fl uorescence, and (d) classifi ed images.
include but are not limited to (1) the SNR of the raw spectral image
data which can add inaccuracy to classification, and (2) the difference
between the measurements. FITC labels phosphatidylserine in the
plasma membrane, whereas the Raman measure is not targeted to a
specific molecule, but rather the local molecular environment.
Nonetheless, the example highlights the usefulness of creating models
from spectra obtained from widefield Raman images, and using the
models as objective classification mechanisms to determine the
metabolic state of cells.
As a further example of ED and MD, Kalasinsky et al. used an
optical detection method which combines Raman spectroscopy,
fluorescence spectroscopy, and digital imaging to detect and identify
48
pathogens. In this study, widefield fluorescence chemical imaging
was used to rapidly screen large surface areas for biological versus
nonbiological particulates. Once biological particulates were identified
from fluorescence signatures, further identification was performed
using widefield Raman imaging. Each Raman spectrum from the
widefield Raman image was compared with Raman signatures
stored in a library of pathogen spectra. Using this type of detection
method, the researchers were able to identify Bacillus globigii (Bg), a
genetic near-neighbor to Bacillus anthracis (Ba), in an environmental
bioaerosol sample using an ED classifier. Furthermore, eleven classes
of pathogens were organized into training sets. PCA was performed
and a supervised Mahalanobis distance model boundary classifier
was constructed for each of the 11 classes. All training set spectra
were classified correctly when setting the decision threshold at 99
percent. The results suggest that a robust library was created using
the MD classifier.