
Page 205 - Vibrational Spectroscopic Imaging for Biomedical Applications
P. 205
W idefield Raman Imaging of Cells and T issues 181
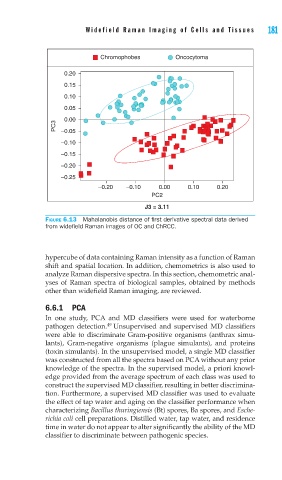
Chromophobes Oncocytoma
0.20
0.15
0.10
0.05
0.00
PC3 –0.05
–0.10
–0.15
–0.20
–0.25
–0.20 –0.10 0.00 0.10 0.20
PC2
J3 = 3.11
FIGURE 6.13 Mahalanobis distance of fi rst derivative spectral data derived
from widefi eld Raman images of OC and ChRCC.
hypercube of data containing Raman intensity as a function of Raman
shift and spatial location. In addition, chemometrics is also used to
analyze Raman dispersive spectra. In this section, chemometric anal-
yses of Raman spectra of biological samples, obtained by methods
other than widefield Raman imaging, are reviewed.
6.6.1 PCA
In one study, PCA and MD classifiers were used for waterborne
49
pathogen detection. Unsupervised and supervised MD classifiers
were able to discriminate Gram-positive organisms (anthrax simu-
lants), Gram-negative organisms (plague simulants), and proteins
(toxin simulants). In the unsupervised model, a single MD classifier
was constructed from all the spectra based on PCA without any prior
knowledge of the spectra. In the supervised model, a priori knowl-
edge provided from the average spectrum of each class was used to
construct the supervised MD classifier, resulting in better discrimina-
tion. Furthermore, a supervised MD classifier was used to evaluate
the effect of tap water and aging on the classifier performance when
characterizing Bacillus thuringiensis (Bt) spores, Ba spores, and Esche-
richia coli cell preparations. Distilled water, tap water, and residence
time in water do not appear to alter significantly the ability of the MD
classifier to discriminate between pathogenic species.