
Page 204 - Vibrational Spectroscopic Imaging for Biomedical Applications
P. 204
180 Cha pte r S i x
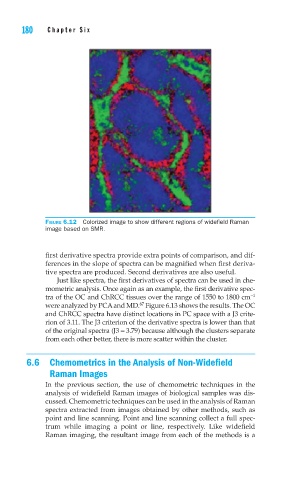
FIGURE 6.12 Colorized image to show different regions of widefi eld Raman
image based on SMR.
first derivative spectra provide extra points of comparison, and dif-
ferences in the slope of spectra can be magnified when first deriva-
tive spectra are produced. Second derivatives are also useful.
Just like spectra, the first derivatives of spectra can be used in che-
mometric analysis. Once again as an example, the first derivative spec-
tra of the OC and ChRCC tissues over the range of 1550 to 1800 cm -1
67
were analyzed by PCA and MD. Figure 6.13 shows the results. The OC
and ChRCC spectra have distinct locations in PC space with a J3 crite-
rion of 3.11. The J3 criterion of the derivative spectra is lower than that
of the original spectra (J3 = 3.79) because although the clusters separate
from each other better, there is more scatter within the cluster.
6.6 Chemometrics in the Analysis of Non-Widefield
Raman Images
In the previous section, the use of chemometric techniques in the
analysis of widefield Raman images of biological samples was dis-
cussed. Chemometric techniques can be used in the analysis of Raman
spectra extracted from images obtained by other methods, such as
point and line scanning. Point and line scanning collect a full spec-
trum while imaging a point or line, respectively. Like widefield
Raman imaging, the resultant image from each of the methods is a