
Page 203 - Vibrational Spectroscopic Imaging for Biomedical Applications
P. 203
W idefield Raman Imaging of Cells and T issues 179
6000
5000
4000
Intensity (a.u) 2000
3000
1000
0
–1000
–2000
–3000
–4000
Raman Shift @ 876 cm –1 1000 1200 1400 1600 1800
–1
Raman Shift (cm )
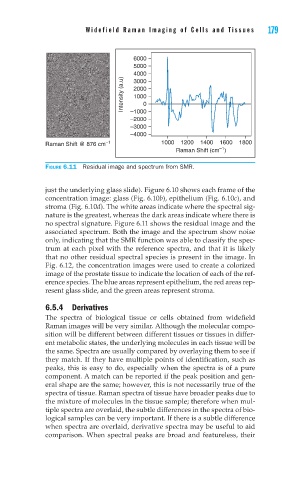
FIGURE 6.11 Residual image and spectrum from SMR.
just the underlying glass slide). Figure 6.10 shows each frame of the
concentration image: glass (Fig. 6.10b), epithelium (Fig. 6.10c), and
stroma (Fig. 6.10d). The white areas indicate where the spectral sig-
nature is the greatest, whereas the dark areas indicate where there is
no spectral signature. Figure 6.11 shows the residual image and the
associated spectrum. Both the image and the spectrum show noise
only, indicating that the SMR function was able to classify the spec-
trum at each pixel with the reference spectra, and that it is likely
that no other residual spectral species is present in the image. In
Fig. 6.12, the concentration images were used to create a colorized
image of the prostate tissue to indicate the location of each of the ref-
erence species. The blue areas represent epithelium, the red areas rep-
resent glass slide, and the green areas represent stroma.
6.5.4 Derivatives
The spectra of biological tissue or cells obtained from widefield
Raman images will be very similar. Although the molecular compo-
sition will be different between different tissues or tissues in differ-
ent metabolic states, the underlying molecules in each tissue will be
the same. Spectra are usually compared by overlaying them to see if
they match. If they have multiple points of identification, such as
peaks, this is easy to do, especially when the spectra is of a pure
component. A match can be reported if the peak position and gen-
eral shape are the same; however, this is not necessarily true of the
spectra of tissue. Raman spectra of tissue have broader peaks due to
the mixture of molecules in the tissue sample; therefore when mul-
tiple spectra are overlaid, the subtle differences in the spectra of bio-
logical samples can be very important. If there is a subtle difference
when spectra are overlaid, derivative spectra may be useful to aid
comparison. When spectral peaks are broad and featureless, their