
Page 198 - Vibrational Spectroscopic Imaging for Biomedical Applications
P. 198
174 Cha pte r S i x
ILC IDC
0.08
0.06
0.04
0.02
0
PC3 –0.02
–0.04
–0.06
–0.08
–0.1
–0.12
0.988 0.99 0.992 0.994 0.996 0.998 1 1.002
PC1
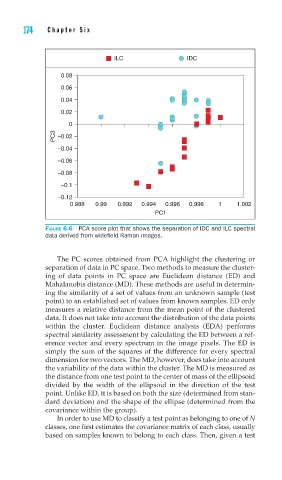
FIGURE 6.6 PCA score plot that shows the separation of IDC and ILC spectral
data derived from widefi eld Raman images.
The PC scores obtained from PCA highlight the clustering or
separation of data in PC space. Two methods to measure the cluster-
ing of data points in PC space are Euclidean distance (ED) and
Mahalanobis distance (MD). These methods are useful in determin-
ing the similarity of a set of values from an unknown sample (test
point) to an established set of values from known samples. ED only
measures a relative distance from the mean point of the clustered
data. It does not take into account the distribution of the data points
within the cluster. Euclidean distance analysis (EDA) performs
spectral similarity assessment by calculating the ED between a ref-
erence vector and every spectrum in the image pixels. The ED is
simply the sum of the squares of the difference for every spectral
dimension for two vectors. The MD, however, does take into account
the variability of the data within the cluster. The MD is measured as
the distance from one test point to the center of mass of the ellipsoid
divided by the width of the ellipsoid in the direction of the test
point. Unlike ED, it is based on both the size (determined from stan-
dard deviation) and the shape of the ellipse (determined from the
covariance within the group).
In order to use MD to classify a test point as belonging to one of N
classes, one first estimates the covariance matrix of each class, usually
based on samples known to belong to each class. Then, given a test