
Page 199 - Vibrational Spectroscopic Imaging for Biomedical Applications
P. 199
W idefield Raman Imaging of Cells and T issues 175
sample, one computes the MD to each class, and classifies the test
point as belonging to that class for which the MD is minimal. Using
the probabilistic interpretation given above, this is equivalent to
selecting the class with the highest probability.
PCA combined with MD calculation not only creates a method to
determine patterns within complex datasets, but also provides a way
to measure and classify unknown data points to these known groups.
Thus a classification system is created for samples that exhibit minor
differences spectroscopically.
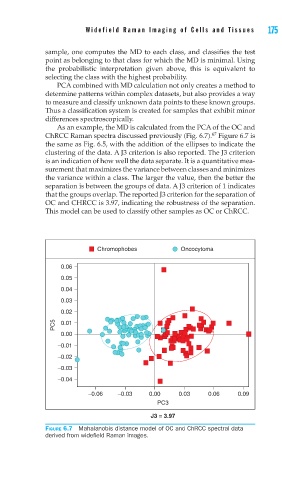
As an example, the MD is calculated from the PCA of the OC and
67
ChRCC Raman spectra discussed previously (Fig. 6.7). Figure 6.7 is
the same as Fig. 6.5, with the addition of the ellipses to indicate the
clustering of the data. A J3 criterion is also reported. The J3 criterion
is an indication of how well the data separate. It is a quantitative mea-
surement that maximizes the variance between classes and minimizes
the variance within a class. The larger the value, then the better the
separation is between the groups of data. A J3 criterion of 1 indicates
that the groups overlap. The reported J3 criterion for the separation of
OC and CHRCC is 3.97, indicating the robustness of the separation.
This model can be used to classify other samples as OC or ChRCC.
Chromophobes Oncocytoma
0.06
0.05
0.04
0.03
0.02
PC5 0.01
0.00
–0.01
–0.02
–0.03
–0.04
–0.06 –0.03 0.00 0.03 0.06 0.09
PC3
J3 = 3.97
FIGURE 6.7 Mahalanobis distance model of OC and ChRCC spectral data
derived from widefi eld Raman images.