
Page 193 - Vibrational Spectroscopic Imaging for Biomedical Applications
P. 193
W idefield Raman Imaging of Cells and T issues 169
simple baseline fits that correct for spectra containing a few Raman
peaks. Often, with biological samples, the spectrum may be more
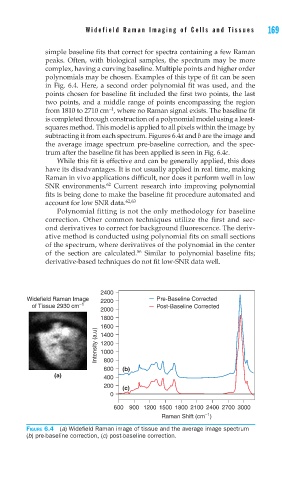
complex, having a curving baseline. Multiple points and higher order
polynomials may be chosen. Examples of this type of fit can be seen
in Fig. 6.4. Here, a second order polynomial fit was used, and the
points chosen for baseline fit included the first two points, the last
two points, and a middle range of points encompassing the region
-1
from 1810 to 2710 cm , where no Raman signal exists. The baseline fit
is completed through construction of a polynomial model using a least-
squares method. This model is applied to all pixels within the image by
subtracting it from each spectrum. Figures 6.4a and b are the image and
the average image spectrum pre-baseline correction, and the spec-
trum after the baseline fit has been applied is seen in Fig. 6.4c.
While this fit is effective and can be generally applied, this does
have its disadvantages. It is not usually applied in real time, making
Raman in vivo applications difficult, nor does it perform well in low
62
SNR environments. Current research into improving polynomial
fits is being done to make the baseline fit procedure automated and
account for low SNR data. 62,63
Polynomial fitting is not the only methodology for baseline
correction. Other common techniques utilize the first and sec-
ond derivatives to correct for background fluorescence. The deriv-
ative method is conducted using polynomial fits on small sections
of the spectrum, where derivatives of the polynomial in the center
56
of the section are calculated. Similar to polynomial baseline fits;
derivative-based techniques do not fit low-SNR data well.
2400
Widefield Raman Image 2200 Pre-Baseline Corrected
of Tissue 2930 cm –1 Post-Baseline Corrected
2000
1800
Intensity (a.u) 1600
1400
1200
1000
800
600 (b)
(a) 400
200 (c)
0
600 900 1200 1500 1800 2100 2400 2700 3000
–1
Raman Shift (cm )
FIGURE 6.4 (a) Widefi eld Raman image of tissue and the average image spectrum
(b) pre-baseline correction, (c) post-baseline correction.