
Page 132 - Volcano and Geothermal Tourism
P. 132
The Cascades 109
eruption itself was very small compared with would be affected should any of the volcanoes once
those from Krakatoa or Taupo, for example, (Case again erupt.
Study 11 and Chapter 19 in this book), at only
3
0.42km of ejecta, but 57 people were killed and Risk management
the damage bill exceeded USD1billion from the While risk management associated with the
associated pyroclastic flows and lahars. This Cascades volcanic threat is now quite sophisticated,
eruption followed that of Lassen Peak (1910s), Mt the myths and legends surrounding the volcanoes
Baker (mid 1800s), and the frequent eruptions of are a documentation of what to expect and how
Glacier Peak, Mt Rainier (most recently 1895), Mt to behave that still have currency today. As a result
Hood, Medicine Lake (the largest volcano in the of this cultural and natural history four national
Cascades), and Mt Shasta (every 300 years, last parks have been created over the Cascades area in
about 1786). The Three Sisters volcanic crater in the USA alone – Lassen Volcanic National Park in
Central Oregon has since 1997 developed a lava 1916, while the Lassen volcano was actually
dome that is being watched closely for signs of an erupting. Mt St Helens is now within a 445km²
imminent eruption. National Volcanic Monument that has been set-
Tourism aside for research, recreation and education. Inside
the monument, the environment is left to respond
Notwithstanding the implied risk associated with naturally to the disturbance from the 1980s
these known and still-active volcanoes (some eruption. From the summer of 1983 visitors have
research suggests perhaps because of this) the been able to drive to Windy Ridge, only 6.4km
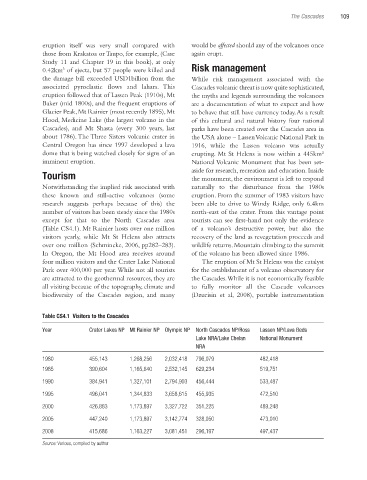
number of visitors has been steady since the 1980s north-east of the crater. From this vantage point
except for that to the North Cascades area tourists can see first-hand not only the evidence
(Table CS4.1). Mt Rainier hosts over one million of a volcano’s destructive power, but also the
visitors yearly, while Mt St Helens also attracts recovery of the land as revegetation proceeds and
over one million (Schmincke, 2006, pp282–283). wildlife returns. Mountain climbing to the summit
In Oregon, the Mt Hood area receives around of the volcano has been allowed since 1986.
four million visitors and the Crater Lake National The eruption of Mt St Helens was the catalyst
Park over 400,000 per year. While not all tourists for the establishment of a volcano observatory for
are attracted to the geothermal resources, they are the Cascades. While it is not economically feasible
all visiting because of the topography, climate and to fully monitor all the Cascade volcanoes
biodiversity of the Cascades region, and many (Dzurisin et al, 2008), portable instrumentation
Table CS4.1 Visitors to the Cascades
Year Crater Lakes NP Mt Rainier NP Olympic NP North Cascades NP/Ross Lassen NP/Lava Beds
Lake NRA/Lake Chelan National Monument
NRA
1980 455,143 1,268,256 2,032,418 796,079 482,418
1985 390,604 1,165,640 2,532,145 629,234 519,751
1990 384,941 1,327,101 2,794,903 456,444 533,487
1995 496,041 1,344,833 3,658,615 455,935 472,510
2000 426,883 1,173,897 3,327,722 351,225 489,248
2005 447,240 1,173,897 3,142,774 328,050 473,010
2008 415,686 1,163,227 3,081,451 296,197 497,437
Source: Various, compiled by author
Ch07.indd 109 3/28/2010 1:28:00 PM