
Page 318 - Volcano and Geothermal Tourism
P. 318
Volcanic Landscapes of New Zealand 295
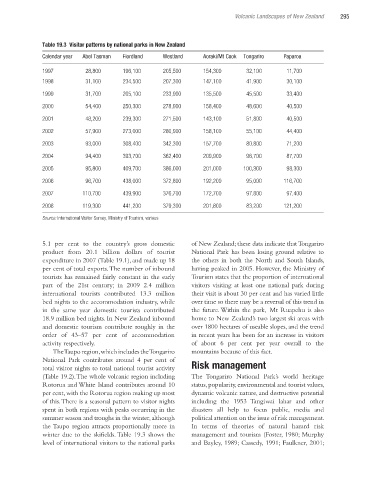
Table 19.3 Visitor patterns by national parks in New Zealand
Calendar year Abel Tasman Fiordland Westland Aoraki/Mt Cook Tongariro Paparoa
1997 28,800 196,100 205,500 154,300 32,100 11,700
1998 31,100 234,500 207,300 147,100 41,900 30,100
1999 31,700 205,100 233,900 135,500 45,500 33,400
2000 54,400 250,300 278,900 158,400 48,600 40,500
2001 48,200 239,300 271,500 143,100 51,800 40,500
2002 57,900 273,000 280,900 158,100 55,100 44,400
2003 93,000 308,400 342,300 157,700 80,800 71,200
2004 94,400 393,700 362,400 209,900 96,700 87,700
2005 95,800 409,700 386,000 201,000 100,300 98,300
2006 96,700 438,000 372,800 192,200 95,000 116,700
2007 110,700 439,900 376,700 172,700 97,800 97,400
2008 119,300 441,200 379,300 201,800 83,200 121,200
Source: International Visitor Survey, Ministry of Tourism, various
5.1 per cent to the country’s gross domestic of New Zealand; these data indicate that Tongariro
product from 20.1 billion dollars of tourist National Park has been losing ground relative to
expenditure in 2007 (Table 19.1), and made up 18 the others in both the North and South Islands,
per cent of total exports. The number of inbound having peaked in 2005. However, the Ministry of
tourists has remained fairly constant in the early Tourism states that the proportion of international
part of the 21st century; in 2009 2.4 million visitors visiting at least one national park during
international tourists contributed 13.3 million their visit is about 30 per cent and has varied little
bed nights to the accommodation industry, while over time so there may be a reversal of this trend in
in the same year domestic tourists contributed the future. Within the park, Mt Ruapehu is also
18.9 million bed nights. In New Zealand inbound home to New Zealand’s two largest ski areas with
and domestic tourism contribute roughly in the over 1800 hectares of useable slopes, and the trend
order of 43–57 per cent of accommodation in recent years has been for an increase in visitors
activity respectively. of about 6 per cent per year overall to the
The Taupo region, which includes the Tongariro mountains because of this fact.
National Park contributes around 4 per cent of
total visitor nights to total national tourist activity Risk management
(Table 19.2). The whole volcanic region including The Tongariro National Park’s world heritage
Rotorua and White Island contributes around 10 status, popularity, environmental and tourist values,
per cent, with the Rotorua region making up most dynamic volcanic nature, and destructive potential
of this. There is a seasonal pattern to visitor nights including the 1953 Tangiwai lahar and other
spent in both regions with peaks occurring in the disasters all help to focus public, media and
summer season and troughs in the winter, although political attention on the issue of risk management.
the Taupo region attracts proportionally more in In terms of theories of natural hazard risk
winter due to the skifields. Table 19.3 shows the management and tourism (Foster, 1980; Murphy
level of international visitors to the national parks and Bayley, 1989; Cassedy, 1991; Faulkner, 2001;
Ch19.indd 295 3/28/2010 1:31:54 PM