
Page 336 - Wastewater Solids Incineration Systems
P. 336
Appendix A Combustion Fundamentals 297
Figure A.2 provides a graphical representation of the availability of heat for no. 2
oil and natural gas (CH ). Curves are shown for various XS air levels and show the
4
percent availability as a function of flue gas exhaust temperature. All of the curves
were developed using an inlet air temperature of 60°F and bone dry air. The adiabatic
flame temperature, or TTPC, is the temperature at zero percent (0%) availability.
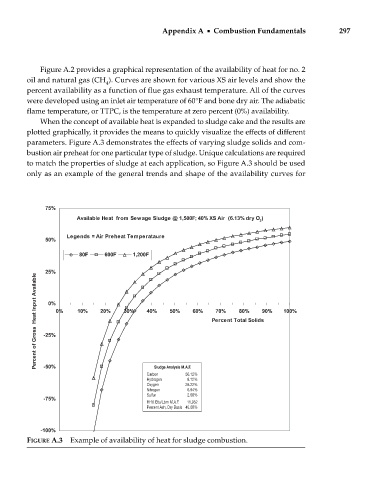
When the concept of available heat is expanded to sludge cake and the results are
plotted graphically, it provides the means to quickly visualize the effects of different
parameters. Figure A.3 demonstrates the effects of varying sludge solids and com-
bustion air preheat for one particular type of sludge. Unique calculations are required
to match the properties of sludge at each application, so Figure A.3 should be used
only as an example of the general trends and shape of the availability curves for
Sludge Analysis M.A.F.
Carbon 56.12%
Hydrogen 8.12%
Oxygen 26.22%
Nitrogen 6.94%
Sulfur 2.60%
HHV, Btu/Lbm M.A.F. 11,952
Percent Ash, Dry Basis 45.00%
FIGURE A.3 Example of availability of heat for sludge combustion.