
Page 127 - Water Engineering Hydraulics, Distribution and Treatment
P. 127
4.5 Demand and Drainage Loads of Buildings
Fixture rates
Table 4.15
3
Rates of supply and discharge ft /min (L/min)
Private
Public and
Type of fixture and supply (1) and
discharge (2)
1 (28)
2 (57)
Wash basin, faucet—(1) and (2)
Water closet, (2) only
6 (170)
8 (227)
Flush tank, (1) only
3 (85)
5 (142)
Flush valve, (1) only
10 (283)
6 (170)
Urinal
(Stall or wall), flush tank (1) only
… (…)
3 (85)
… (…)
5 (142)
(Stall or wall), flush valve buildings office buildings 105
(Pedestal), flush valve … (…) 10 (283)
Bathtub or shower, faucet or mixing valve 2 (57) 4 (113)
Bathroom group (2) only 8 (227) … (…)
Flush tank for closet, (1) only 6 (170) … (…)
Flush valve for closet, (1) only 8 (227) … (…)
Separate shower head, (1) only 2 (57) … (…)
Separate shower stall, (2) only 10 (283) … (…)
Kitchen sink, faucet 2 2 (57) 4 (113)
Laundry trays (1–3), faucet 3 (85) … (…)
Combination fixture, faucet 3 (85) … (…)
Service sink, faucet (hotel or restaurant) … (…) 3 (85)
Sill cock 2∕3 (19) 2∕3 (19)
3 3
Conversion factor: 1 ft ∕min = 28.32 L∕min = 0.02832 m ∕min.
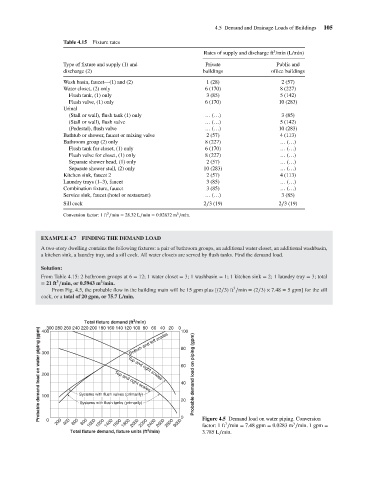
EXAMPLE 4.7 FINDING THE DEMAND LOAD
A two-story dwelling contains the following fixtures: a pair of bathroom groups, an additional water closet, an additional washbasin,
a kitchen sink, a laundry tray, and a sill cock. All water closets are served by flush tanks. Find the demand load.
Solution:
From Table 4.15: 2 bathroom groups at 6 = 12; 1 water closet = 3; 1 washbasin = 1; 1 kitchen sink = 2; 1 laundry tray = 3; total
3
3
= 21 ft ∕min, or 0.5943 m /min.
3
From Fig. 4.5, the probable flow in the building main will be 15 gpm plus [(2∕3) ft ∕min = (2∕3) × 7.48 = 5 gpm] for the sill
cock, or a total of 20 gpm, or 75.7 L/min.
3
Total fixture demand (ft /min) 0 100
220
200 180 160 140 120 100 80 60 40 20
300 280 260
240
Probable demand load on water piping (gpm) 300 Systems with flush valves (primarily) 80 Probable demand load on piping (gpm)
400
Bottom and left scales
60
200
Top and right scales
40
Top and right scales
100
20
Systems with flush tanks (primarily)
600
0
200
400
1800
1600
1400
2400
2200
2000
1000
800
1200
3
3
factor: 1 ft ∕min = 7.48 gpm = 0.0283 m ∕min. 1 gpm =
3
Total fixture demand, fixture units (ft /min) 2600 2800 3000 0 Figure 4.5 Demand load on water piping. Conversion
3.785 L∕min.