
Page 142 - Water Loss Control
P. 142
124 Cha pte r T e n
AWWA WLCC Water Audit Software: Reporting Worksheet Back to Instructions
Copyriht © 2006, American Water Works Association. All Rights Reserved. WASv3.0
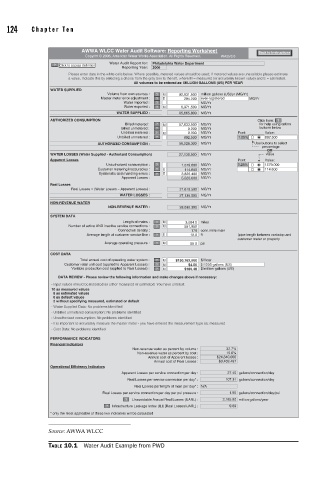
Water Audit Report for: Philadelphia Water Department
? Click to access definition
Reporting Year: 2006
Please enter data in the white cells below. Where possible, metered values should be used; if metered values are unavailable please estimate
a value. Indicate this by selecting a choice from the gray box to the left, where M = measured (or accurately known value) and E = estimated.
All volumes to be entered as: MILLION GALLONS (US) PER YEAR
WATER SUPPLIED
Volume from own sources : ? M 92,931.500 million gallons (US)/yr (MG/Yr)
Master meter error adjustment : ? E 294.200 over-registered MG/Yr
Water imported : ? MG/Yr
Water exported : ? M 6,971.500 MG/Yr
WATER SUPPLIED : 85,665.800 MG/Yr
AUTHORIZED CONSUMPTION Click here: ?
Billed metered : ? M 57,633.500 MG/Yr for help using option
Billed unmetered : ? 0.000 MG/Yr buttons below
Unbilled metered : ? M 0.300 MG/Yr Pcnt: Value:
Unbilled unmetered : ? 892.500 MG/Yr 1.25% 892.500
AUTHORIZED CONSUMPTION : 58,526.300 MG/Yr Use buttons to select
percentage
OR
WATER LOSSES (Water Supplied - Authorized Consumption) 27,139.500 MG/Yr value
Apparent Losses Pcnt: Value:
Unauthorized consumption : ? 1,579.000 MG/Yr 0.25% 1579.000
Customer metering inaccuracies : ? E 114.600 MG/Yr 114.600
Systematic data handling errors : ? E 3,826.400 MG/Yr
Apparent Losses : 5,520.000 MG/Yr
Real Losses
Real Losses = (Water Losses – Apparent Losses) : 21,619.500 MG/Yr
WATER LOSSES : 27,139.500 MG/Yr
NON-REVENUE WATER
NON-REVENUE WATER : 28,032.300 MG/Yr
SYSTEM DATA
Length of mains : ? M 3,084.0 miles
Number of active AND inactive service connections : ? M 551,959
Connection density : 179 conn./mile main
Average length of customer service line : ? E 12.0 ft (pipe length between curbstop and
customer meter or property
Average operating pressure : ? M 55 0 psi
COST DATA
Total annual cost of operating water system : ? M $190,162,000 $/Year
Customer retail unit cost (applied to Apparent Losses) : ? M $4.50 $/1000 gallons (US)
Variable production cost (applied to Real Losses) : ? M $160.48 $/million gallons (US)
DATA REVIEW - Please review the following information and make changes above if necessary:
- Input values should be indicated as either measured or estimated. You have entered:
10 as measured values
6 as estimated values
0 as default values
2 without specifying measured, estimated or default
- Water Supplied Data: No problems identified
- Unbilled unmetered consumption: No problems identified
- Unauthorized consumption: No problems identified
- It is important to accurately measure the master meter - you have entered the measurement type as: measured
- Cost Data: No problems identified
PERFORMANCE INDICATORS
Financial Indicators
Non-revenue water as percent by volume : 32.7%
Non-revenue water as percent by cost : 15.0%
Annual cost of Apparent losses : $24,840,000
Annual cost of Real Losses : $3,469,497
Operational Efficiency Indicators
Apparent Losses per service connection per day : 27.40 gallons/connection/day
Real Losses per service connection per day* : 107.31 gallons/connection/day
Real Losses per length of main per day* : N/A
Real Losses per service connection per day per psi pressure : 1.95 gallons/connection/day/psi
? Unavoidable Annual Real Losses (UARL) : 2,185.90 million gallons/year
? Infrastructure Leakage Index (ILI) [Real Losses/UARL] : 9.89
* only the most applicable of these two indicators will be calculated
Source: AWWA WLCC
TABLE 10.1 Water Audit Example from PWD