
Page 147 - Water Loss Control
P. 147
Modelling W ater Losses 127
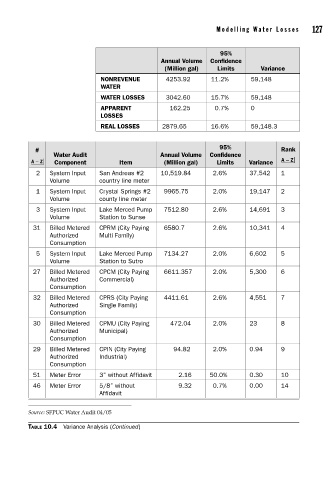
95%
Annual Volume Confidence
(Million gal) Limits Variance
NONREVENUE 4253.92 11.2% 59,148
WATER
WATER LOSSES 3042.60 15.7% 59,148
APPARENT 162.25 0.7% 0
LOSSES
REAL LOSSES 2879.65 16.6% 59,148.3
95%
# Rank
Water Audit Annual Volume Confidence
A − Z Component Item (Million gal) Limits Variance A − Z
2 System Input San Andreas #2 10,519.84 2.6% 37,542 1
Volume country line meter
1 System Input Crystal Springs #2 9965.75 2.0% 19,147 2
Volume county line meter
3 System Input Lake Merced Pump 7512.80 2.6% 14,691 3
Volume Station to Sunse
31 Billed Metered CPRM (City Paying 6580.7 2.6% 10,341 4
Authorized Multi Family)
Consumption
5 System Input Lake Merced Pump 7134.27 2.0% 6,602 5
Volume Station to Sutro
27 Billed Metered CPCM (City Paying 6611.357 2.0% 5,300 6
Authorized Commercial)
Consumption
32 Billed Metered CPRS (City Paying 4411.61 2.6% 4,551 7
Authorized Single Family)
Consumption
30 Billed Metered CPMU (City Paying 472.04 2.0% 23 8
Authorized Municipal)
Consumption
29 Billed Metered CPIN (City Paying 94.82 2.0% 0.94 9
Authorized Industrial)
Consumption
51 Meter Error 3” without Affidavit 2.16 50.0% 0.30 10
46 Meter Error 5/8” without 9.32 0.7% 0.00 14
Affidavit
Source: SFPUC Water Audit 04/05
TABLE 10.4 Variance Analysis (Continued)