
Page 148 - Water Loss Control
P. 148
128 Cha pte r T e n
95%
# Rank
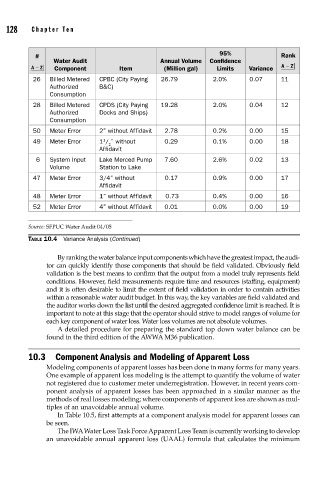
Water Audit Annual Volume Confidence
A − Z Component Item (Million gal) Limits Variance A − Z
26 Billed Metered CPBC (City Paying 26.79 2.0% 0.07 11
Authorized B&C)
Consumption
28 Billed Metered CPDS (City Paying 19.28 2.0% 0.04 12
Authorized Docks and Ships)
Consumption
50 Meter Error 2” without Affidavit 2.78 0.2% 0.00 15
1
49 Meter Error 1 / ” without 0.29 0.1% 0.00 18
2
Affidavit
6 System Input Lake Merced Pump 7.60 2.6% 0.02 13
Volume Station to Lake
47 Meter Error 3/4” without 0.17 0.9% 0.00 17
Affidavit
48 Meter Error 1” without Affidavit 0.73 0.4% 0.00 16
52 Meter Error 4” without Affidavit 0.01 0.0% 0.00 19
Source: SFPUC Water Audit 04/05
TABLE 10.4 Variance Analysis (Continued)
By ranking the water balance input components which have the greatest impact, the audi-
tor can quickly identify those components that should be field validated. Obviously field
validation is the best means to confirm that the output from a model truly represents field
conditions. However, field measurements require time and resources (staffing, equipment)
and it is often desirable to limit the extent of field validation in order to contain activities
within a reasonable water audit budget. In this way, the key variables are field validated and
the auditor works down the list until the desired aggregated confidence limit is reached. It is
important to note at this stage that the operator should strive to model ranges of volume for
each key component of water loss. Water loss volumes are not absolute volumes.
A detailed procedure for preparing the standard top down water balance can be
found in the third edition of the AWWA M36 publication.
10.3 Component Analysis and Modeling of Apparent Loss
Modeling components of apparent losses has been done in many forms for many years.
One example of apparent loss modeling is the attempt to quantify the volume of water
not registered due to customer meter underregistration. However, in recent years com-
ponent analysis of apparent losses has been approached in a similar manner as the
methods of real losses modeling; where components of apparent loss are shown as mul-
tiples of an unavoidable annual volume.
In Table 10.5, first attempts at a component analysis model for apparent losses can
be seen.
The IWA Water Loss Task Force Apparent Loss Team is currently working to develop
an unavoidable annual apparent loss (UAAL) formula that calculates the minimum