
Page 192 - Water Loss Control
P. 192
166 Cha pte r Ele v e n
a number of distinct components, and subcomponents, of apparent losses occur in
water utilities; therefore a revenue protection program must be tailored to the individ-
6
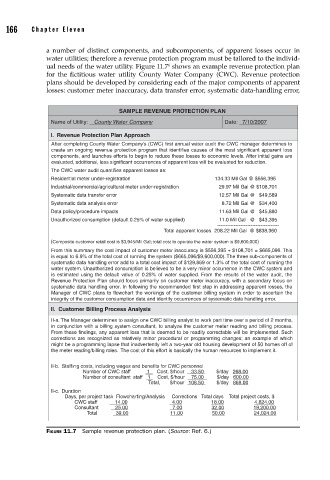
ual needs of the water utility. Figure 11.7 shows an example revenue protection plan
for the fictitious water utility County Water Company (CWC). Revenue protection
plans should be developed by considering each of the major components of apparent
losses: customer meter inaccuracy, data transfer error, systematic data-handling error,
SAMPLE REVENUE PROTECTION PLAN
Name of Utility: County Water Company Date: 7/10/2007
I. Revenue Protection Plan Approach
After completing County Water Company’s (CWC) first annual water audit the CWC manager determines to
create an ongoing revenue protection program that identifies causes of the most significant apparent loss
components, and launches efforts to begin to reduce these losses to economic levels. After initial gains are
evaluated, additional, less significant occurrences of apparent loss will be evaluated for reduction.
The CWC water audit quantifies apparent losses as:
Residential meter under-registration 134.33 Mil Gal @ $556,395
Industrial/commercial/agricultural meter under-registration 29.97 Mil Gal @ $108,701
Systematic data transfer error 12.57 Mil Gal @ $49,589
Systematic data analysis error 8.72 Mil Gal @ $34,400
Data policy/procedure impacts 11.63 Mil Gal @ $45,880
Unauthorized consumption (default 0.25% of water supplied) 11.0 Mil Gal @ $43,395
-------------------------------------
Total apparent losses 208.22 Mil Gal @ $838,360
(Composite customer retail cost is $3,945/Mil Gal; total cost to operate the water system is $9,600,000)
From this summary the cost impact of customer meter inaccuracy is $556,395 + $108,701 = $665,096. This
is equal to 6.9% of the total cost of running the system ($665,096/$9,600,000). The three sub-components of
systematic data handling error add to a total cost impact of $129,869 or 1.3% of the total cost of running the
water system. Unauthorized consumption is believed to be a very minor occurrence in the CWC system and
is estimated using the default value of 0.25% of water supplied. From the results of the water audit, the
Revenue Protection Plan should focus primarily on customer meter inaccuracy, with a secondary focus on
systematic data handling error. In following the recommended first step in addressing apparent losses, the
Manager of CWC plans to flowchart the workings of the customer billing system in order to ascertain the
integrity of the customer consumption data and identify occurrences of systematic data handling error.
II. Customer Billing Process Analysis
II-a. The Manager determines to assign one CWC billing analyst to work part time over a period of 2 months,
in conjunction with a billing system consultant, to analyze the customer meter reading and billing process.
From these findings, any apparent loss that is deemed to be readily correctable will be implemented. Such
corrections are recognized as relatively minor procedural or programming changes; an example of which
might be a programming lapse that inadvertently left a two-year old housing development of 50 homes off of
the meter reading/billing roles. The cost of this effort is basically the human resources to implement it.
II-b. Staffing costs, including wages and benefits for CWC personnel
Number of CWC staff 1 Cost, $/hour 33.50 $/day 268.00
Number of consultant staff 1 Cost, $/hour 75.00 $/day 600.00
Total, $/hour 108.50 $/day 868.00
II-c. Duration
Days, per project task Flowcharting/Analysis Corrections Total days Total project costs, $
CWC staff 14.00 4.00 18.00 4,824.00
Consultant 25.00 7.00 32.00 19,200.00
Total 39.00 11.00 50.00 24,024.00
FIGURE 11.7 Sample revenue protection plan. (Source: Ref. 6.)