
Page 204 - Water Loss Control
P. 204
178 Cha pte r T w e l v e
Waterford MUA (Colgate Drive) Minimum
Average
344.70
Maximum
306.40
268.10
Flow rate (gpm) 191.50
229.80
153.20
114.90
76.60
38.30
0.00
9/4/96 3:06:50 p.m. to 9/11/96 1:06:50 p.m.
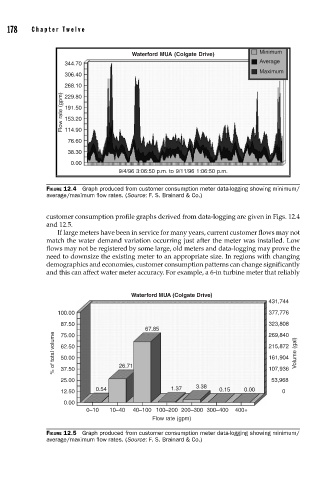
FIGURE 12.4 Graph produced from customer consumption meter data-logging showing minimum/
average/maximum fl ow rates. (Source: F. S. Brainard & Co.)
customer consumption profile graphs derived from data-logging are given in Figs. 12.4
and 12.5.
If large meters have been in service for many years, current customer flows may not
match the water demand variation occurring just after the meter was installed. Low
flows may not be registered by some large, old meters and data-logging may prove the
need to downsize the existing meter to an appropriate size. In regions with changing
demographics and economies, customer consumption patterns can change significantly
and this can affect water meter accuracy. For example, a 6-in turbine meter that reliably
Waterford MUA (Colgate Drive)
431,744
100.00 377,776
87.50 323,808
67.85 269,840
% of total volume 62.50 26.71 215,872 Volume (gal)
75.00
50.00
161,904
37.50
25.00 107,936
53,968
0.54 1.37 3.38 0.15 0.00
12.50 0
0.00
0–10 10–40 40–100 100–200 200–300 300–400 400+
Flow rate (gpm)
FIGURE 12.5 Graph produced from customer consumption meter data-logging showing minimum/
average/maximum fl ow rates. (Source: F. S. Brainard & Co.)