
Page 209 - Water Loss Control
P. 209
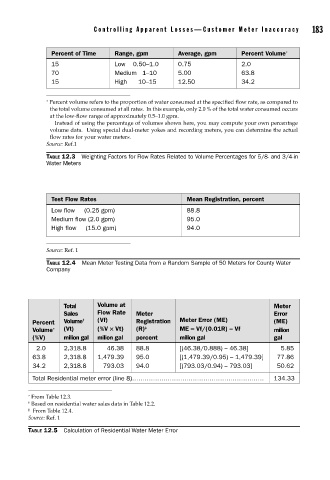
Contr olling Appar ent Losses—Customer Meter Inaccuracy       183


                      Percent of Time   Range, gpm        Average, gpm      Percent Volume ∗
                      15                Low    0.50–1.0   0.75              2.0
                      70                Medium   1–10     5.00              63.8
                      15                High      10–15   12.50             34.2

                    ∗  Percent volume refers to the proportion of water consumed at the specified flow rate, as compared to
                     the total volume consumed at all rates.  In this example, only 2.0 % of the total water consumed occurs
                     at the low-flow range of approximately 0.5–1.0 gpm.
                        Instead of using the percentage of volumes shown here, you may compute your own percentage
                     volume data.  Using special dual-meter yokes and recording meters, you can determine the actual
                     flow rates for your water meters.
                    Source: Ref.1
                    TABLE 12.3  Weighting Factors for Flow Rates Related to Volume Percentages for 5/8- and 3/4-in
                    Water Meters


                      Test Flow Rates                       Mean Registration, percent
                      Low flow     (0.25 gpm)               88.8
                      Medium flow (2.0 gpm)                 95.0
                      High flow     (15.0 gpm)              94.0


                    Source: Ref. 1
                    TABLE 12.4  Mean Meter Testing Data from a Random Sample of 50 Meters for County Water
                    Company


                         Total     Volume at                                         Meter
                         Sales     Flow Rate   Meter                                 Error
                Percent   Volume †  (Vf)      Registration  Meter Error (ME)         (ME)
                Volume ∗  (Vt)     (%V ë Vt)  (R) ‡       ME = Vf/(0.01R) – Vf       milion
                (%V)     milion gal  milion gal  percent  milion gal                 gal
                  2.0    2,318.8        46.38  88.8       [(46.38/0.888) – 46.38]        5.85
                63.8     2,318.8   1,479.39   95.0        [(1,479.39/0.95) – 1,479.39]   77.86
                34.2     2,318.8      793.03  94.0        [(793.03/0.94) – 793.03]    50.62
                Total Residential meter error (line 8)………………………………………………………          134.33

               ∗  From Table 12.3.
               †  Based on residential water sales data in Table 12.2.
               ‡   From Table 12.4.
               Source: Ref. 1
               TABLE 12.5  Calculation of Residential Water Meter Error