
Page 213 - Water Loss Control
P. 213
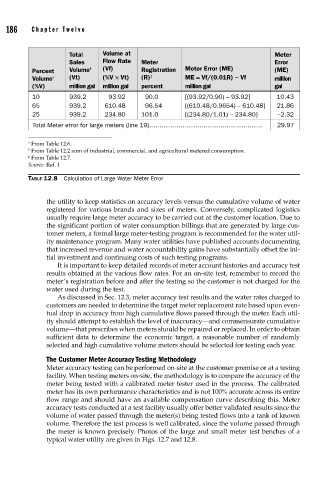
186    Cha pte r  T w e l v e


                           Total    Volume at                                         Meter
                           Sales    Flow Rate   Meter                                 Error
                Percent    Volume †  (Vf)      Registration  Meter Error (ME)         (ME)
                Volume ∗   (Vt)     (%V ë Vt)  (R) ‡        ME = Vf/(0.01R) - Vf      million
                (%V)       million gal  million gal  percent  million gal             gal
                10         939.2      93.92      90.0       [(93.92/0.90) – 93.92]    10.43
                65         939.2     610.48      96.54      [(610.48/0.9654) – 610.48]  21.86
                25         939.2     234.80    101.0        [(234.80/1.01) – 234.80]  −2.32
                Total Meter error for large meters (line 19)………………………………………………        29.97

               ∗  From Table 12.6.
               †  From Table 12.2 sum of industrial, commercial, and agricultural metered consumption.
               ‡  From Table 12.7.
               Source: Ref. 1
               TABLE 12.8  Calculation of Large Water Meter Error


                    the utility to keep statistics on accuracy levels versus the cumulative volume of water
                    registered for various brands and sizes of meters. Conversely, complicated logistics
                    usually require large meter accuracy to be carried out at the customer location. Due to
                    the significant portion of water consumption billings that are generated by large cus-
                    tomer meters, a formal large meter-testing program is recommended for the water util-
                    ity maintenance program. Many water utilities have published accounts documenting
                    that increased revenue and water accountability gains have substantially offset the ini-
                    tial investment and continuing costs of such testing programs.
                       It is important to keep detailed records of meter account histories and accuracy test
                    results obtained at the various flow rates. For an on-site test, remember to record the
                    meter’s registration before and after the testing so the customer is not charged for the
                    water used during the test.
                       As discussed in Sec. 12.3, meter accuracy test results and the water rates charged to
                    customers are needed to determine the target meter replacement rate based upon even-
                    tual drop in accuracy from high cumulative flows passed through the meter. Each util-
                    ity should attempt to establish the level of inaccuracy—and commensurate cumulative
                    volume—that prescribes when meters should be repaired or replaced. In order to obtain
                    sufficient data to determine the economic target, a reasonable number of randomly
                    selected and high cumulative volume meters should be selected for testing each year.

                    The Customer Meter Accuracy Testing Methodology
                    Meter accuracy testing can be performed on-site at the customer premise or at a testing
                    facility. When testing meters on-site, the methodology is to compare the accuracy of the
                    meter being tested with a calibrated meter tester used in the process. The calibrated
                    meter has its own performance characteristics and is not 100% accurate across its entire
                    flow range and should have an available compensation curve describing this. Meter
                    accuracy tests conducted at a test facility usually offer better validated results since the
                    volume of water passed through the meter(s) being tested flows into a tank of known
                    volume. Therefore the test process is well calibrated, since the volume passed through
                    the meter is known precisely. Photos of the large and small meter test benches of a
                    typical water utility are given in Figs. 12.7 and 12.8.