
Page 24 - Water Loss Control
P. 24
6 Cha pte r T w o
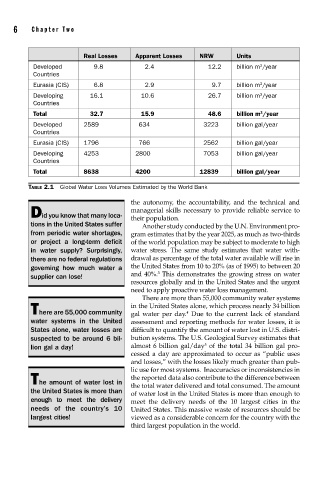
Real Losses Apparent Losses NRW Units
3
Developed 9.8 2.4 12.2 billion m /year
Countries
Eurasia (CIS) 6.8 2.9 9.7 billion m /year
3
Developing 16.1 10.6 26.7 billion m /year
3
Countries
3
Total 32.7 15.9 48.6 billion m /year
Developed 2589 634 3223 billion gal/year
Countries
Eurasia (CIS) 1796 766 2562 billion gal/year
Developing 4253 2800 7053 billion gal/year
Countries
Total 8638 4200 12839 billion gal/year
TABLE 2.1 Global Water Loss Volumes Estimated by the World Bank
the autonomy, the accountability, and the technical and
managerial skills necessary to provide reliable service to
Did you know that many loca-
their population.
tions in the United States suffer Another study conducted by the U.N. Environment pro-
from periodic water shortages, gram estimates that by the year 2025, as much as two-thirds
or project a long-term deficit of the world population may be subject to moderate to high
in water supply? Surprisingly, water stress. The same study estimates that water with-
there are no federal regulations drawal as percentage of the total water available will rise in
governing how much water a the United States from 10 to 20% (as of 1995) to between 20
and 40%. This demonstrates the growing stress on water
3
supplier can lose!
resources globally and in the United States and the urgent
need to apply proactive water loss management.
There are more than 55,000 community water systems
in the United States alone, which process nearly 34 billion
There are 55,000 community gal water per day. Due to the current lack of standard
4
water systems in the United assessment and reporting methods for water losses, it is
States alone, water losses are difficult to quantify the amount of water lost in U.S. distri-
suspected to be around 6 bil- bution systems. The U.S. Geological Survey estimates that
5
lion gal a day! almost 6 billion gal/day of the total 34 billion gal pro-
cessed a day are approximated to occur as “public uses
and losses,” with the losses likely much greater than pub-
lic use for most systems. Inaccuracies or inconsistencies in
the reported data also contribute to the difference between
The amount of water lost in
the total water delivered and total consumed. The amount
the United States is more than
of water lost in the United States is more than enough to
enough to meet the delivery meet the delivery needs of the 10 largest cities in the
needs of the country’s 10 United States. This massive waste of resources should be
largest cities! viewed as a considerable concern for the country with the
third largest population in the world.