Page 327 - Water Loss Control
P. 327

296    Cha pte r  Se v e ntee n


                             Losses flex with pressure  Pressure   Economic level of real losses
                                                    management

                                                    Unavoidable
                                                     annual real
                                                      losses
                                  Speed and quality                   Active
                                    of repairs                     leakage control
                                                    Potentially
                                                  recoverable real
                                                     losses

                                                   Pipeline and
                                                 asset management
                            Current annual real losses  selection,
                                                    installation,
                                                   maintenance,
                                                     renewal,
                                                   replacement

                    FIGURE 17.1  Four potential intervention tools of an active real loss management program.
                    (Source: IWA Water Loss Task Force and AWWA Water Loss Control Committee.)

                         Repair Time: This is the time to affect a repair that halts the leakage flow, once the
                         location of the leak has been identified. This is not just the time of the shutoff or
                         repair action, but all time needed to route the repair work order, schedule the
                         repair, notify customers, and other activities, which can take days or weeks
                         depending upon the policies of the water utility.
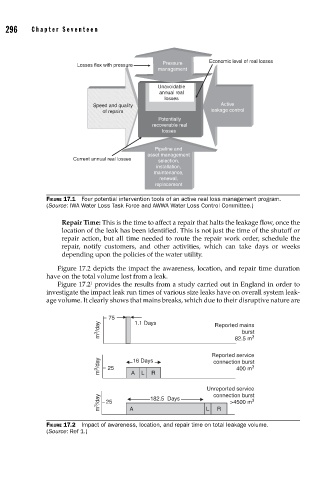
                       Figure 17.2 depicts the impact the awareness, location, and repair time duration
                    have on the total volume lost from a leak.
                                 1
                       Figure 17.2  provides the results from a study carried out in England in order to
                    investigate the impact leak run times of various size leaks have on overall system leak-
                    age volume. It clearly shows that mains breaks, which due to their disruptive nature are

                                      75     1.1 Days
                                   m 3 /day                         Reported mains
                                                                            burst
                                                                               3
                                                                          82.5 m
                                                                    Reported service
                                   m 3 /day  25  A  L  R            connection burst
                                              16 Days
                                                                               3
                                                                           400 m
                                                                  Unreported service
                                   m 3 /day  25  A  182.5  Days   L  connection burst
                                                                               3
                                                                         >4500 m
                                                                     R
                    FIGURE 17.2  Impact of awareness, location, and repair time on total leakage volume.
                    (Source: Ref 1.)
   322   323   324   325   326   327   328   329   330   331   332