
Page 41 - Water Loss Control
P. 41
Understanding the Types of W ater Losses 23
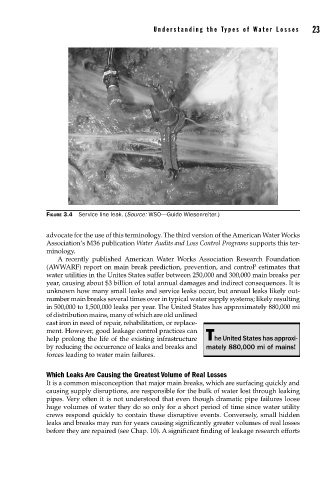
FIGURE 3.4 Service line leak. (Source: WSO—Guido Wiesenreiter.)
advocate for the use of this terminology. The third version of the American Water Works
Association‘s M36 publication Water Audits and Loss Control Programs supports this ter-
minology.
A recently published American Water Works Association Research Foundation
3
(AWWARF) report on main break prediction, prevention, and control estimates that
water utilities in the Unites States suffer between 250,000 and 300,000 main breaks per
year, causing about $3 billion of total annual damages and indirect consequences. It is
unknown how many small leaks and service leaks occur, but annual leaks likely out-
number main breaks several times over in typical water supply systems; likely resulting
in 500,000 to 1,500,000 leaks per year. The United States has approximately 880,000 mi
of distribution mains, many of which are old unlined
cast iron in need of repair, rehabilitation, or replace-
ment. However, good leakage control practices can
help prolong the life of the existing infrastructure The United States has approxi-
by reducing the occurrence of leaks and breaks and mately 880,000 mi of mains!
forces leading to water main failures.
Which Leaks Are Causing the Greatest Volume of Real Losses
It is a common misconception that major main breaks, which are surfacing quickly and
causing supply disruptions, are responsible for the bulk of water lost through leaking
pipes. Very often it is not understood that even though dramatic pipe failures loose
huge volumes of water they do so only for a short period of time since water utility
crews respond quickly to contain these disruptive events. Conversely, small hidden
leaks and breaks may run for years causing significantly greater volumes of real losses
before they are repaired (see Chap. 10). A significant finding of leakage research efforts