
Page 59 - Water Loss Control
P. 59
What is Necessary to Contr ol the W ater Loss Pr oblem? 41
Office of Water Services (Ofwat); which most com-
panies have achieved due to their ability to quickly
implement the recommendations of their leakage Severe drought in the United
reduction research. Enormous efforts to control Kingdom in the mid-1990s
water losses were undertaken in the United Kingdom prompted mandatory leakage
since the early 1990s, with water loss reduction reduction—a scenario that
being a major operational task for water utilities. could materialize in the United
Today, water companies in the United Kingdom States given its many drought-
have a detailed understanding of their components stricken regions.
of water losses and the economic optimum of their
losses. The water companies now operate “trans-
parently” in calculating and publicizing data on their water loss volumes. Most compa-
nies claim that they have reached, or will reach soon, their economic optimum level of
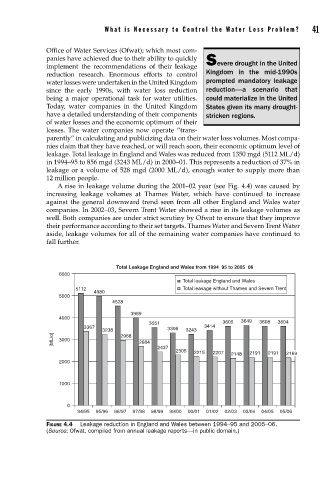
leakage. Total leakage in England and Wales was reduced from 1350 mgd (5112 ML/d)
in 1994–95 to 856 mgd (3243 ML/d) in 2000–01. This represents a reduction of 37% in
leakage or a volume of 528 mgd (2000 ML/d), enough water to supply more than
12 million people.
A rise in leakage volume during the 2001–02 year (see Fig. 4.4) was caused by
increasing leakage volumes at Thames Water, which have continued to increase
against the general downward trend seen from all other England and Wales water
companies. In 2002–03, Severn Trent Water showed a rise in its leakage volumes as
well. Both companies are under strict scrutiny by Ofwat to ensure that they improve
their performance according to their set targets. Thames Water and Severn Trent Water
aside, leakage volumes for all of the remaining water companies have continued to
fall further.
Total Leakage England and Wales from 1994 95 to 2005 06
6000
Total leakage England and Wales
5112 Total leakage without Thames and Severn Trent
4980
5000
4528
3989
4000
3551 3605 3649 3608 3604
3367 3306 3414
3238 3243
[ML/d] 3000 2968 2684
2437
2305 2215 2207 2148 2191 2191 2169
2000
1000
0
94/95 95/96 96/97 97/98 98/99 99/00 00/01 01/02 02/03 03/04 04/05 05/06
FIGURE 4.4 Leakage reduction in England and Wales between 1994–95 and 2005–06.
(Source: Ofwat, compiled from annual leakage reports—in public domain.)