
Page 56 - Water Loss Control
P. 56
38 Cha pte r F o u r
Percentage of losses as % system input volume: 325/3245 mg = 10%
Same utility in with per capita consumption of 200 gal/cap/d:
Total system input volume: 1785 mg
Total consumption volume: 1460 mg
Total losses: 325 mg
Percentage of losses as % system input volume: 325/1785 mg = 18%
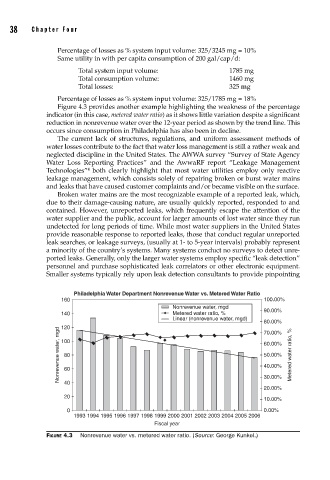
Figure 4.3 provides another example highlighting the weakness of the percentage
indicator (in this case, metered water ratio) as it shows little variation despite a significant
reduction in nonrevenue water over the 12-year period as shown by the trend line. This
occurs since consumption in Philadelphia has also been in decline.
The current lack of structures, regulations, and uniform assessment methods of
water losses contribute to the fact that water loss management is still a rather weak and
neglected discipline in the United States. The AWWA survey “Survey of State Agency
Water Loss Reporting Practices” and the AwwaRF report “Leakage Management
4
Technologies” both clearly highlight that most water utilities employ only reactive
leakage management, which consists solely of repairing broken or burst water mains
and leaks that have caused customer complaints and/or became visible on the surface.
Broken water mains are the most recognizable example of a reported leak, which,
due to their damage-causing nature, are usually quickly reported, responded to and
contained. However, unreported leaks, which frequently escape the attention of the
water supplier and the public, account for larger amounts of lost water since they run
undetected for long periods of time. While most water suppliers in the United States
provide reasonable response to reported leaks, those that conduct regular unreported
leak searches, or leakage surveys, (usually at 1- to 5-year intervals) probably represent
a minority of the country’s systems. Many systems conduct no surveys to detect unre-
ported leaks. Generally, only the larger water systems employ specific “leak detection”
personnel and purchase sophisticated leak correlators or other electronic equipment.
Smaller systems typically rely upon leak detection consultants to provide pinpointing
Philadelphia Water Department Nonrevenue Water vs. Metered Water Ratio
160 100.00%
Nonrevenue water, mgd
90.00%
140 Metered water ratio, %
Linear (nonrevenue water, mgd)
80.00%
120
Nonrevenue water, mgd 100 60.00% Metered water ratio, %
70.00%
50.00%
80
40.00%
60
30.00%
40
20.00%
20
10.00%
0 0.00%
1993 1994 1995 1996 1997 1998 1999 2000 2001 2002 2003 2004 2005 2006
Fiscal year
FIGURE 4.3 Nonrevenue water vs. metered water ratio. (Source: George Kunkel.)