
Page 53 - Water Loss Control
P. 53
What is Necessary to Contr ol the W ater Loss Pr oblem? 35
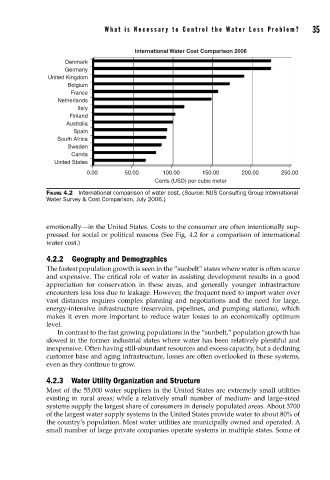
International Water Cost Comparison 2006
Denmark
Germany
United Kingdom
Belgium
France
Netherlands
Italy
Finland
Australia
Spain
South Africa
Sweden
Canda
United States
0.00 50.00 100.00 150.00 200.00 250.00
Cents (USD) per cubic meter
FIGURE 4.2 International comparison of water cost. (Source: NUS Consulting Group International
Water Survey & Cost Comparison, July 2006.)
emotionally—in the United States. Costs to the consumer are often intentionally sup-
pressed for social or political reasons (See Fig. 4.2 for a comparison of international
water cost.)
4.2.2 Geography and Demographics
The fastest population growth is seen in the “sunbelt” states where water is often scarce
and expensive. The critical role of water in assisting development results in a good
appreciation for conservation in these areas, and generally younger infrastructure
encounters less loss due to leakage. However, the frequent need to import water over
vast distances requires complex planning and negotiations and the need for large,
energy-intensive infrastructure (reservoirs, pipelines, and pumping stations), which
makes it even more important to reduce water losses to an economically optimum
level.
In contrast to the fast growing populations in the “sunbelt,” population growth has
slowed in the former industrial states where water has been relatively plentiful and
inexpensive. Often having still-abundant resources and excess capacity, but a declining
customer base and aging infrastructure, losses are often overlooked in these systems,
even as they continue to grow.
4.2.3 Water Utility Organization and Structure
Most of the 55,000 water suppliers in the United States are extremely small utilities
existing in rural areas; while a relatively small number of medium- and large-sized
systems supply the largest share of consumers in densely populated areas. About 3700
of the largest water supply systems in the United States provide water to about 80% of
the country’s population. Most water utilities are municipally owned and operated. A
small number of large private companies operate systems in multiple states. Some of