Page 101 - Water and Wastewater Engineering Design Principles and Practice
P. 101

2-44   WATER AND WASTEWATER ENGINEERING

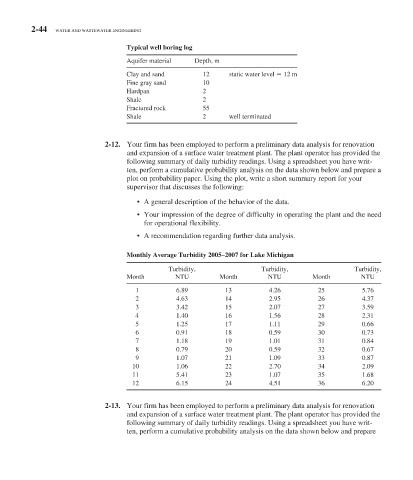
                                     Typical well boring log

                                     Aquifer material   Depth, m
                                     Clay and sand        12      static water level   12 m
                                     Fine gray sand       10
                                     Hardpan              2
                                     Shale                2
                                     Fractured rock       55
                                     Shale                2       well terminated


                                    2-12.   Your firm has been employed to perform a preliminary data analysis for renovation
                                     and expansion of a surface water treatment plant. The plant operator has provided the
                                     following summary of daily turbidity readings. Using a spreadsheet you have writ-
                                     ten, perform a cumulative probability analysis on the data shown below and prepare a
                                     plot on probability paper. Using the plot, write a short summary report for your
                                     supervisor that discusses the following:

                                           •  A general description of the behavior of the data.
                                          •  Your impression of the degree of difficulty in operating the plant and the need
                                          for operational flexibility.
                                          •  A recommendation regarding further data analysis.


                                     Monthly Average Turbidity 2005–2007 for Lake Michigan
                                                 Turbidity,                Turbidity,                Turbidity,
                                     Month         NTU         Month         NTU         Month         NTU
                                       1           6.89          13          4.26          25          5.76
                                       2           4.63          14          2.95          26          4.37
                                        3          3.42          15          2.07          27          3.59
                                       4           1.40          16          1.56          28          2.31
                                        5          1.25          17          1.11          29          0.66
                                       6           0.91          18          0.59          30          0.73
                                       7           1.18          19          1.01          31          0.84
                                       8           0.79          20          0.59          32          0.67
                                       9           1.07          21          1.09          33          0.87
                                      10           1.06          22          2.70          34          2.09
                                      11           5.41          23          1.07          35          1.68
                                      12           6.15          24          4.51          36          6.20

                                              2-13.   Your firm has been employed to perform a preliminary data analysis for renovation
                                     and expansion of a surface water treatment plant. The plant operator has provided the
                                     following summary of daily turbidity readings. Using a spreadsheet you have writ-
                                     ten, perform a cumulative probability analysis on the data shown below and prepare
   96   97   98   99   100   101   102   103   104   105   106