Page 143 - Water and wastewater engineering
P. 143

3-40   WATER AND WASTEWATER ENGINEERING

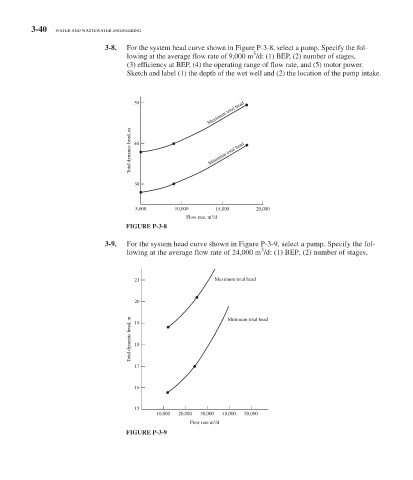
                                       3-8.    For the system head curve shown in  Figure P-3-8 , select a pump. Specify the fol-
                                                                         3
                                     lowing at the average flow rate of 9,000 m  /d: (1) BEP, (2) number of stages,
                                     (3) efficiency at BEP, (4) the operating range of flow rate, and (5) motor power.
                                     Sketch and label (1) the depth of the wet well and (2) the location of the pump intake.


                                                            Maximum total head
                                       50


                                      Total dynamic head, m  40  Minimum total head


                                       30


                                       5,000      10,000      15,000     20,000
                                                      Flow rate, m 3 /d
                                      FIGURE P-3-8

                                   3-9.    For the system head curve shown in  Figure P-3-9 , select a pump. Specify the fol-
                                                                           3
                                     lowing at the average flow rate of 24,000 m   /d: (1) BEP, (2) number of stages,


                                       21                     Maximum total head


                                       20                        Minimum total head

                                      Total dynamic head, m  19


                                       18


                                       17

                                       16


                                       15
                                             10,000  20,000  30,000  40,000  50,000
                                                             3
                                                       Flow rate m /d
                                       FIGURE P-3-9
   138   139   140   141   142   143   144   145   146   147   148