Page 335 - Water and wastewater engineering
P. 335

8-4   WATER AND WASTEWATER ENGINEERING

                            sites, (4) exchange of the ions by reaction, (5) diffusion of the exchanged ions outward through
                            the pores to the solid surface, (6) diffusion of the exchanged ions through the boundary layer, and
                            (7) movement of the exchanged ions into the bulk solution.
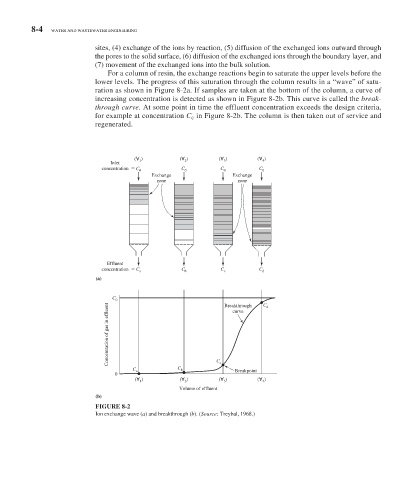
                                 For a column of resin, the exchange reactions begin to saturate the upper levels before the
                            lower levels. The progress of this saturation through the column results in a “wave” of satu-
                            ration as shown in  Figure 8-2a . If samples are taken at the bottom of the column, a curve of
                            increasing concentration is detected as shown in  Figure 8-2b . This curve is called the  break-
                            through curve.  At some point in time the effluent concentration exceeds the design criteria,
                            for example at concentration  C    c    in  Figure 8-2b . The column is then taken out of service and
                            regenerated.


                                         )          (  )       (  )       (  )
                                       (  1          2          3          4
                                Inlet
                              concentration    C 0  C 0        C 0        C 0
                                            Exchange               Exchange
                                             zone                   zone


                               Effluent
                              concentration   C a   C b        C c        C d
                            (a)


                                 C 0                            Breakthrough  C d
                                Concentration of gas in effluent
                                                                   curve


                                       C a         C b        C c  Breakpoint
                                  0
                                       (  )         (  )       (  )       (  )
                                         1           2          3          4
                                                    Volume of effluent
                            (b)
                              FIGURE 8-2
                               Ion exchange wave ( a ) and breakthrough ( b ).   ( Source:  Treybal, 1968.)
   330   331   332   333   334   335   336   337   338   339   340