
Page 472 - Water and wastewater engineering
P. 472
GRANULAR FILTRATION 11-45
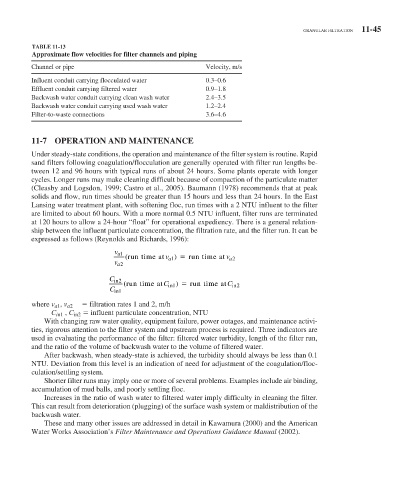
TABLE 11-13
Approximate flow velocities for filter channels and piping
Channel or pipe Velocity, m/s
Influent conduit carrying flocculated water 0.3–0.6
Effluent conduit carrying filtered water 0.9–1.8
Backwash water conduit carrying clean wash water 2.4–3.5
Backwash water conduit carrying used wash water 1.2–2.4
Filter-to-waste connections 3.6–4.6
11-7 OPERATION AND MAINTENANCE
Under steady-state conditions, the operation and maintenance of the filter system is routine. Rapid
sand filters following coagulation/flocculation are generally operated with filter run lengths be-
tween 12 and 96 hours with typical runs of about 24 hours. Some plants operate with longer
cycles. Longer runs may make cleaning difficult because of compaction of the particulate matter
(Cleasby and Logsdon, 1999; Castro et al., 2005). Baumann (1978) recommends that at peak
solids and flow, run times should be greater than 15 hours and less than 24 hours. In the East
Lansing water treatment plant, with softening floc, run times with a 2 NTU influent to the filter
are limited to about 60 hours. With a more normal 0.5 NTU influent, filter runs are terminated
at 120 hours to allow a 24-hour “float” for operational expediency. There is a general relation-
ship between the influent particulate concentration, the filtration rate, and the filter run. It can be
expressed as follows (Reynolds and Richards, 1996):
v a1
(runtimeat v a1 ) runtimeat v a2
v a2
C in2
( runtimeat C in1 ) runtimeat C in2
C in1
where v a 1 , v a 2 filtration rates 1 and 2, m/h
C in 1 , C in 2 influent particulate concentration, NTU
With changing raw water quality, equipment failure, power outages, and maintenance activi-
ties, rigorous attention to the filter system and upstream process is required. Three indicators are
used in evaluating the performance of the filter: filtered water turbidity, length of the filter run,
and the ratio of the volume of backwash water to the volume of filtered water.
After backwash, when steady-state is achieved, the turbidity should always be less than 0.1
NTU. Deviation from this level is an indication of need for adjustment of the coagulation/floc-
culation/settling system.
Shorter filter runs may imply one or more of several problems. Examples include air binding,
accumulation of mud balls, and poorly settling floc.
Increases in the ratio of wash water to filtered water imply difficulty in cleaning the filter.
This can result from deterioration (plugging) of the surface wash system or maldistribution of the
backwash water.
These and many other issues are addressed in detail in Kawamura (2000) and the American
Water Works Association’s Filter Maintenance and Operations Guidance Manual (2002).