
Page 475 - Water and wastewater engineering
P. 475
11-48 WATER AND WASTEWATER ENGINEERING
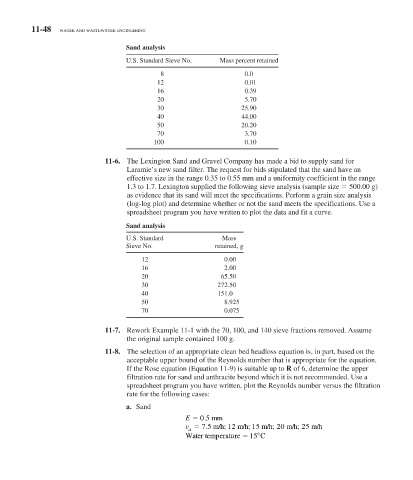
Sand analysis
U.S. Standard Sieve No. Mass percent retained
8 0.0
12 0.01
16 0.39
20 5.70
30 25.90
40 44.00
50 20.20
70 3.70
100 0.10
11-6. The Lexington Sand and Gravel Company has made a bid to supply sand for
Laramie’s new sand filter. The request for bids stipulated that the sand have an
effective size in the range 0.35 to 0.55 mm and a uniformity coefficient in the range
1.3 to 1.7. Lexington supplied the following sieve analysis (sample size 500.00 g)
as evidence that its sand will meet the specifications. Perform a grain size analysis
(log-log plot) and determine whether or not the sand meets the specifications. Use a
spreadsheet program you have written to plot the data and fit a curve.
Sand analysis
U.S. Standard Mass
Sieve No. retained, g
12 0.00
16 2.00
20 65.50
30 272.50
40 151.0
50 8.925
70 0.075
11-7. Rework Example 11-1 with the 70, 100, and 140 sieve fractions removed. Assume
the original sample contained 100 g.
11-8. The selection of an appropriate clean bed headloss equation is, in part, based on the
acceptable upper bound of the Reynolds number that is appropriate for the equation.
If the Rose equation (Equation 11-9) is suitable up to R of 6, determine the upper
filtration rate for sand and anthracite beyond which it is not recommended. Use a
spreadsheet program you have written, plot the Reynolds number versus the filtration
rate for the following cases:
a. Sand
E 0 5. mm
;
v 7 5. m/h ; 12 m/h ; 15 m/h ; 20 m/h 25 m/h
a
Water temperature 15 C