
Page 54 - Well Logging and Formation Evaluation
P. 54
44 Well Logging and Formation Evaluation
than the static mud pressure). The pretest pressure is measured as a
pressure that is anomalously high.
• Dry test. If the formation is very tight, there may be a very slow buildup
of pressure in the pretest chambers, and it is not operationally feasible
to attempt to wait until equilibrium is reached.
• Anomalous gradients. If sands are isolated even over geological time
scales, then they may lie on different pressure trends, not sharing a
common aquifer of FWL. Also, if any depletion has occurred in the reser-
voir or the reservoir is not in a true equilibrium state (for instance, due to
a slowly leaking seal or fault), then gradients may not be meaningful.
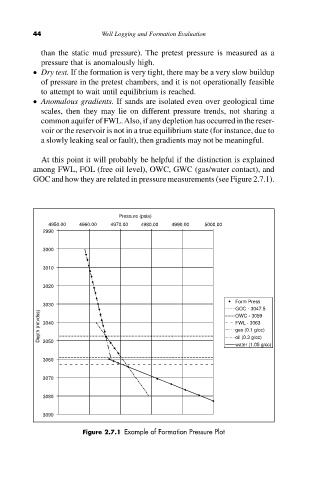
At this point it will probably be helpful if the distinction is explained
among FWL, FOL (free oil level), OWC, GWC (gas/water contact), and
GOC and how they are related in pressure measurements (see Figure 2.7.1).
Pressure (psia)
4950.00 4960.00 4970.00 4980.00 4990.00 5000.00
2990
3000
3010
3020
Form Press
3030
GOC - 3047.5
Depth (mtvdss) 3040 FWL - 3063
OWC - 3059
gas (0.1 g/cc)
oil (0.3 g/cc)
3050
water (1.05 g/cc)
3060
3070
3080
3090
Figure 2.7.1 Example of Formation Pressure Plot