
Page 51 - Well Logging and Formation Evaluation
P. 51
Quicklook Log Interpretation 41
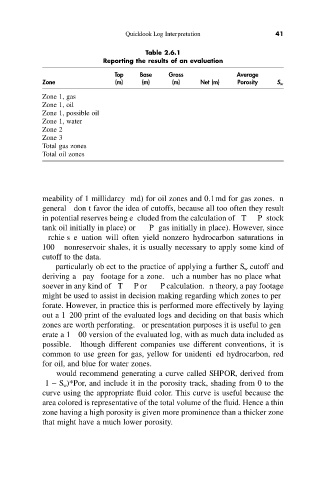
Table 2.6.1
Reporting the results of an evaluation
Top Base Gross Average
Zone (m) (m) (m) Net (m) Porosity S w
Zone 1, gas
Zone 1, oil
Zone 1, possible oil
Zone 1, water
Zone 2
Zone 3
Total gas zones
Total oil zones
meability of 1 millidarcy (md) for oil zones and 0.1md for gas zones. In
general I don’t favor the idea of cutoffs, because all too often they result
in potential reserves being excluded from the calculation of STOIIP (stock
tank oil initially in place) or GIIP (gas initially in place). However, since
Archie’s equation will often yield nonzero hydrocarbon saturations in
100% nonreservoir shales, it is usually necessary to apply some kind of
cutoff to the data.
I particularly object to the practice of applying a further S w cutoff and
deriving a “pay” footage for a zone. Such a number has no place what-
soever in any kind of STOIIP or GIIP calculation. In theory, a pay footage
might be used to assist in decision making regarding which zones to per-
forate. However, in practice this is performed more effectively by laying
out a 1:200 print of the evaluated logs and deciding on that basis which
zones are worth perforating. For presentation purposes it is useful to gen-
erate a 1:500 version of the evaluated log, with as much data included as
possible. Although different companies use different conventions, it is
common to use green for gas, yellow for unidentified hydrocarbon, red
for oil, and blue for water zones.
I would recommend generating a curve called SHPOR, derived from
(1 - S w)*Por, and include it in the porosity track, shading from 0 to the
curve using the appropriate fluid color. This curve is useful because the
area colored is representative of the total volume of the fluid. Hence a thin
zone having a high porosity is given more prominence than a thicker zone
that might have a much lower porosity.