
Page 48 - Well Logging and Formation Evaluation
P. 48
38 Well Logging and Formation Evaluation
R t (ohmm)
Porosity
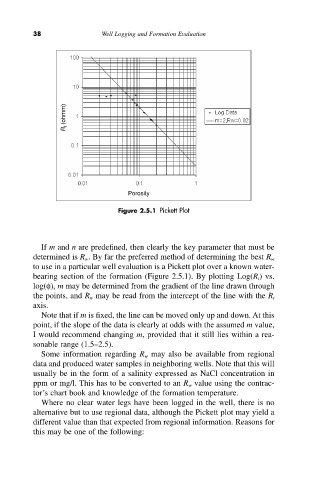
Figure 2.5.1 Pickett Plot
If m and n are predefined, then clearly the key parameter that must be
determined is R w. By far the preferred method of determining the best R w
to use in a particular well evaluation is a Pickett plot over a known water-
bearing section of the formation (Figure 2.5.1). By plotting Log(R t ) vs.
log(f), m may be determined from the gradient of the line drawn through
the points, and R w may be read from the intercept of the line with the R t
axis.
Note that if m is fixed, the line can be moved only up and down. At this
point, if the slope of the data is clearly at odds with the assumed m value,
I would recommend changing m, provided that it still lies within a rea-
sonable range (1.5–2.5).
Some information regarding R w may also be available from regional
data and produced water samples in neighboring wells. Note that this will
usually be in the form of a salinity expressed as NaCl concentration in
ppm or mg/l. This has to be converted to an R w value using the contrac-
tor’s chart book and knowledge of the formation temperature.
Where no clear water legs have been logged in the well, there is no
alternative but to use regional data, although the Pickett plot may yield a
different value than that expected from regional information. Reasons for
this may be one of the following: