
Page 43 - Well Logging and Formation Evaluation
P. 43
Quicklook Log Interpretation 33
penetrated in the well (or a neighboring well), one should already have a
good idea of what the resistivity ought to be for a water-bearing sand. If
the resistivity is higher than this value, whatever the shape of the curve,
then hydrocarbons should be suspected.
Obviously any mud-log data (gas shows, fluorescence) should be exam-
ined in the event that it is not clear whether or not the formation is hydro-
carbon bearing. However, the mud log can certainly not be relied on to
always pick up hydrocarbons, particularly where the sands are thin and
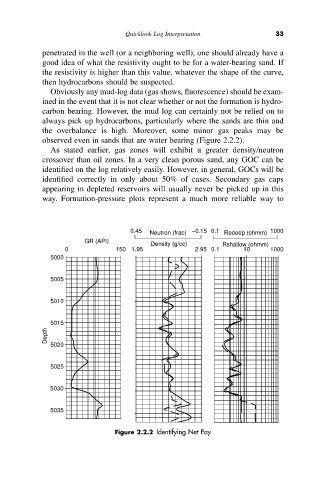
the overbalance is high. Moreover, some minor gas peaks may be
observed even in sands that are water bearing (Figure 2.2.2).
As stated earlier, gas zones will exhibit a greater density/neutron
crossover than oil zones. In a very clean porous sand, any GOC can be
identified on the log relatively easily. However, in general, GOCs will be
identified correctly in only about 50% of cases. Secondary gas caps
appearing in depleted reservoirs will usually never be picked up in this
way. Formation-pressure plots represent a much more reliable way to
0.45 Neutron (frac) –0.15 0.1 Redeep (ohmm) 1000
GR (API)
Density (g/cc) Rshallow (ohmm)
0 150 1.95 2.95 0.1 10 1000
5000
5005
5010
5015
Depth
5020
5025
5030
5035
Figure 2.2.2 Identifying Net Pay