
Page 45 - Well Logging and Formation Evaluation
P. 45
Quicklook Log Interpretation 35
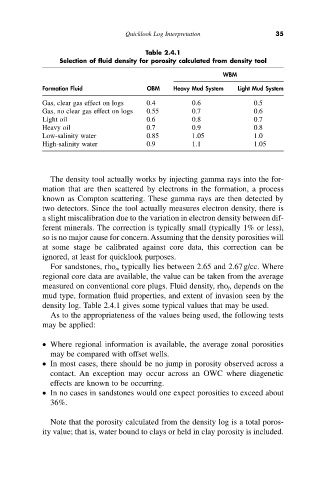
Table 2.4.1
Selection of fluid density for porosity calculated from density tool
WBM
Formation Fluid OBM Heavy Mud System Light Mud System
Gas, clear gas effect on logs 0.4 0.6 0.5
Gas, no clear gas effect on logs 0.55 0.7 0.6
Light oil 0.6 0.8 0.7
Heavy oil 0.7 0.9 0.8
Low-salinity water 0.85 1.05 1.0
High-salinity water 0.9 1.1 1.05
The density tool actually works by injecting gamma rays into the for-
mation that are then scattered by electrons in the formation, a process
known as Compton scattering. These gamma rays are then detected by
two detectors. Since the tool actually measures electron density, there is
a slight miscalibration due to the variation in electron density between dif-
ferent minerals. The correction is typically small (typically 1% or less),
so is no major cause for concern. Assuming that the density porosities will
at some stage be calibrated against core data, this correction can be
ignored, at least for quicklook purposes.
For sandstones, rho m typically lies between 2.65 and 2.67g/cc. Where
regional core data are available, the value can be taken from the average
measured on conventional core plugs. Fluid density, rho f, depends on the
mud type, formation fluid properties, and extent of invasion seen by the
density log. Table 2.4.1 gives some typical values that may be used.
As to the appropriateness of the values being used, the following tests
may be applied:
• Where regional information is available, the average zonal porosities
may be compared with offset wells.
• In most cases, there should be no jump in porosity observed across a
contact. An exception may occur across an OWC where diagenetic
effects are known to be occurring.
• In no cases in sandstones would one expect porosities to exceed about
36%.
Note that the porosity calculated from the density log is a total poros-
ity value; that is, water bound to clays or held in clay porosity is included.