
Page 44 - Well Logging and Formation Evaluation
P. 44
34 Well Logging and Formation Evaluation
0.8
0.7
0.6
0.5
V p /V s 0.4 gas sands
oil sands
0.3
0.2
0.1
0
4900 5000 5100 5200 5300 5400 5500
(m/s)
V p
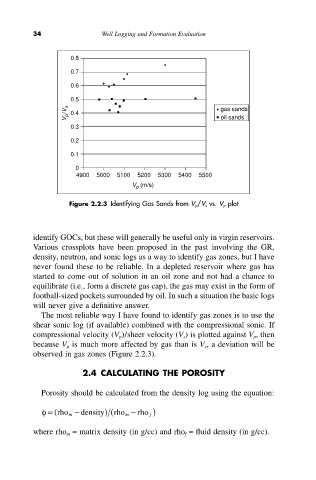
Figure 2.2.3 Identifying Gas Sands from V p/V s vs. V p plot
identify GOCs, but these will generally be useful only in virgin reservoirs.
Various crossplots have been proposed in the past involving the GR,
density, neutron, and sonic logs as a way to identify gas zones, but I have
never found these to be reliable. In a depleted reservoir where gas has
started to come out of solution in an oil zone and not had a chance to
equilibrate (i.e., form a discrete gas cap), the gas may exist in the form of
football-sized pockets surrounded by oil. In such a situation the basic logs
will never give a definitive answer.
The most reliable way I have found to identify gas zones is to use the
shear sonic log (if available) combined with the compressional sonic. If
compressional velocity (V p)/sheer velocity (V s) is plotted against V p, then
because V p is much more affected by gas than is V s, a deviation will be
observed in gas zones (Figure 2.2.3).
2.4 CALCULATING THE POROSITY
Porosity should be calculated from the density log using the equation:
- density )
f= (rho m ) (rho m - rho f
where rho m = matrix density (in g/cc) and rho f = fluid density (in g/cc).