
Page 41 - Well Logging and Formation Evaluation
P. 41
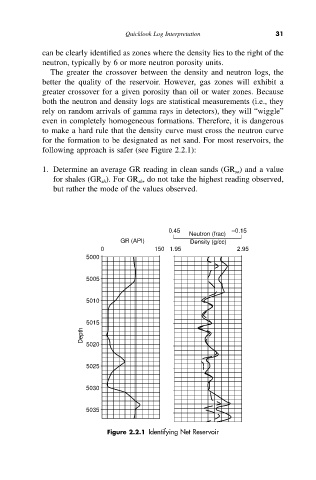
Quicklook Log Interpretation            31

            can be clearly identified as zones where the density lies to the right of the
            neutron, typically by 6 or more neutron porosity units.
               The greater the crossover between the density and neutron logs, the
            better the quality of the reservoir. However, gas zones will exhibit a
            greater crossover for a given porosity than oil or water zones. Because
            both the neutron and density logs are statistical measurements (i.e., they
            rely on random arrivals of gamma rays in detectors), they will “wiggle”
            even in completely homogeneous formations. Therefore, it is dangerous
            to make a hard rule that the density curve must cross the neutron curve
            for the formation to be designated as net sand. For most reservoirs, the
            following approach is safer (see Figure 2.2.1):

            1. Determine an average GR reading in clean sands (GR sa ) and a value
               for shales (GR sh ). For GR sh , do not take the highest reading observed,
               but rather the mode of the values observed.


                                              0.45             –0.15
                                                    Neutron (frac)
                                 GR (API)           Density (g/cc)
                            0             150 1.95               2.95
                        5000

                        5005


                        5010


                        5015
                       Depth
                        5020


                        5025

                        5030


                        5035


                              Figure 2.2.1 Identifying Net Reservoir