
Page 71 - Well Logging and Formation Evaluation
P. 71
Saturation/Height Analysis 61
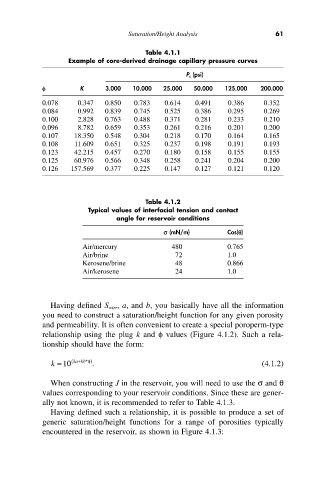
Table 4.1.1
Example of core-derived drainage capillary pressure curves
P c (psi)
f K 3.000 10.000 25.000 50.000 125.000 200.000
0.078 0.347 0.850 0.783 0.614 0.491 0.386 0.352
0.084 0.992 0.839 0.745 0.525 0.386 0.295 0.269
0.100 2.828 0.763 0.488 0.371 0.281 0.233 0.210
0.096 8.782 0.659 0.353 0.261 0.216 0.201 0.200
0.107 18.350 0.548 0.304 0.218 0.170 0.164 0.165
0.108 11.609 0.651 0.325 0.237 0.198 0.191 0.193
0.123 42.215 0.457 0.270 0.180 0.158 0.155 0.155
0.125 60.976 0.566 0.348 0.258 0.241 0.204 0.200
0.126 157.569 0.377 0.225 0.147 0.127 0.121 0.120
Table 4.1.2
Typical values of interfacial tension and contact
angle for reservoir conditions
s (mN/m) Cos(q)
Air/mercury 480 0.765
Air/brine 72 1.0
Kerosene/brine 48 0.866
Air/kerosene 24 1.0
Having defined S wirr, a, and b, you basically have all the information
you need to construct a saturation/height function for any given porosity
and permeability. It is often convenient to create a special poroperm-type
relationship using the plug k and f values (Figure 4.1.2). Such a rela-
tionship should have the form:
( ka kb*f )
+
k = 10 . (4.1.2)
When constructing J in the reservoir, you will need to use the s and q
values corresponding to your reservoir conditions. Since these are gener-
ally not known, it is recommended to refer to Table 4.1.3.
Having defined such a relationship, it is possible to produce a set of
generic saturation/height functions for a range of porosities typically
encountered in the reservoir, as shown in Figure 4.1.3: