
Page 73 - Well Logging and Formation Evaluation
P. 73
Saturation/Height Analysis 63
Height (m)
120 120
100 100
80 80 0.13
P c (psi) 60 60 0.08
0.06
0.10
0.11
40 40
20 20
0 0
0.0 0.2 0.4 0.6 0.8 1.0
S w
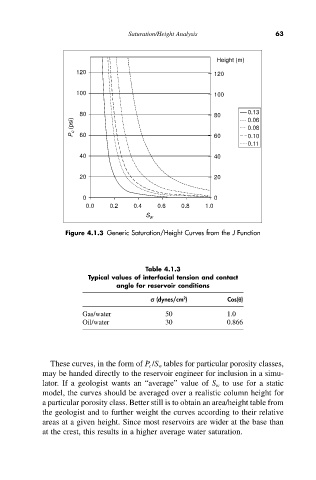
Figure 4.1.3 Generic Saturation/Height Curves from the J Function
Table 4.1.3
Typical values of interfacial tension and contact
angle for reservoir conditions
2
s (dynes/cm ) Cos(q)
Gas/water 50 1.0
Oil/water 30 0.866
These curves, in the form of P c /S w tables for particular porosity classes,
may be handed directly to the reservoir engineer for inclusion in a simu-
lator. If a geologist wants an “average” value of S w to use for a static
model, the curves should be averaged over a realistic column height for
a particular porosity class. Better still is to obtain an area/height table from
the geologist and to further weight the curves according to their relative
areas at a given height. Since most reservoirs are wider at the base than
at the crest, this results in a higher average water saturation.