
Page 96 - Well Logging and Formation Evaluation
P. 96
86 Well Logging and Formation Evaluation
mean and spread of the data points. This is often called a “member-
ship function.”
4. The same would be done for all the shale values, generating a new
membership function with its own mean and spread.
5. Both membership functions would be normalized so that the area
underneath them is unity.
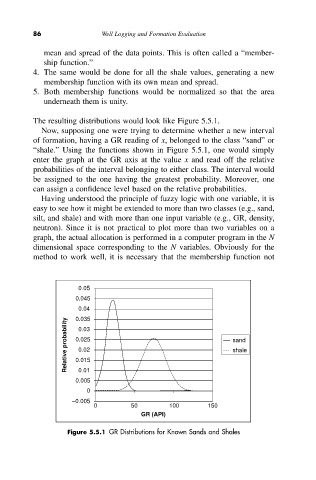
The resulting distributions would look like Figure 5.5.1.
Now, supposing one were trying to determine whether a new interval
of formation, having a GR reading of x, belonged to the class “sand” or
“shale.” Using the functions shown in Figure 5.5.1, one would simply
enter the graph at the GR axis at the value x and read off the relative
probabilities of the interval belonging to either class. The interval would
be assigned to the one having the greatest probability. Moreover, one
can assign a confidence level based on the relative probabilities.
Having understood the principle of fuzzy logic with one variable, it is
easy to see how it might be extended to more than two classes (e.g., sand,
silt, and shale) and with more than one input variable (e.g., GR, density,
neutron). Since it is not practical to plot more than two variables on a
graph, the actual allocation is performed in a computer program in the N
dimensional space corresponding to the N variables. Obviously for the
method to work well, it is necessary that the membership function not
0.05
0.045
0.04
0.035
Relative probability 0.025 sand
0.03
0.02
shale
0.015
0.01
0.005
0
–0.005
0 50 100 150
GR (API)
Figure 5.5.1 GR Distributions for Known Sands and Shales