
Page 99 - Well Logging and Formation Evaluation
P. 99
Advanced Log Interpretation Techniques 89
Note that the situation of the laminae being perpendicular to the bore-
hole represents the worst case in terms of the suppression effect on the
resistivity. Where the borehole is inclined to the bedding, the resistivity
is affected less, and there are published equations for determining the
resistivity measured as a function of the orientation angle and R shale , R sand .
Another technique that has been applied is the Thomas-Stieber plot.
This will now be explained. Start by considering a clean sand with poros-
ity f i and containing water with a hydrogen index of HI w. There are three
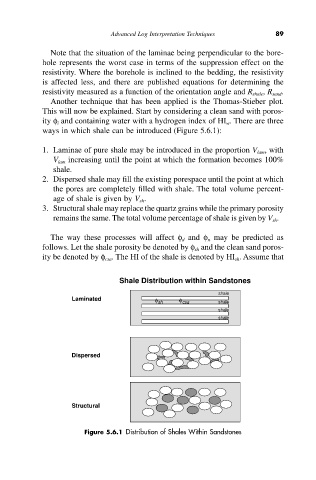
ways in which shale can be introduced (Figure 5.6.1):
1. Laminae of pure shale may be introduced in the proportion V lam , with
V lam increasing until the point at which the formation becomes 100%
shale.
2. Dispersed shale may fill the existing porespace until the point at which
the pores are completely filled with shale. The total volume percent-
age of shale is given by V sh .
3. Structural shale may replace the quartz grains while the primary porosity
remains the same. The total volume percentage of shale is given by V sh .
The way these processes will affect f d and f n may be predicted as
follows. Let the shale porosity be denoted by f sh and the clean sand poros-
ity be denoted by f csa . The HI of the shale is denoted by HI sh . Assume that
Shale Distribution within Sandstones
shale
Laminated f sh f csa shale
shale
shale
Dispersed
Structural
Figure 5.6.1 Distribution of Shales Within Sandstones