
Page 102 - Well Logging and Formation Evaluation
P. 102
92 Well Logging and Formation Evaluation
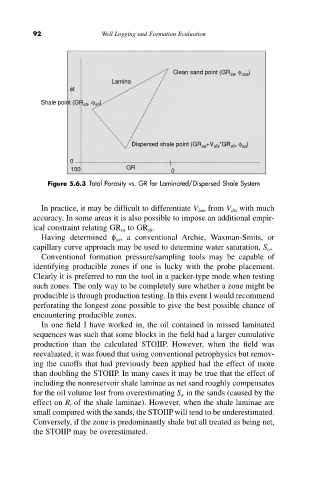
Clean sand point (GR , f csa )
sa
Lamina
ft
Shale point (GR , j )
sh
sh
Dispersed shale point (GR +V *GR , f )
sh
sa
sa
dis
0
100 GR 0
Figure 5.6.3 Total Porosity vs. GR for Laminated/Dispersed Shale System
In practice, it may be difficult to differentiate V lam from V dis with much
accuracy. In some areas it is also possible to impose an additional empir-
ical constraint relating GR sa to GR sh .
Having determined f sa , a conventional Archie, Waxman-Smits, or
capillary curve approach may be used to determine water saturation, S w.
Conventional formation pressure/sampling tools may be capable of
identifying producible zones if one is lucky with the probe placement.
Clearly it is preferred to run the tool in a packer-type mode when testing
such zones. The only way to be completely sure whether a zone might be
producible is through production testing. In this event I would recommend
perforating the longest zone possible to give the best possible chance of
encountering producible zones.
In one field I have worked in, the oil contained in missed laminated
sequences was such that some blocks in the field had a larger cumulative
production than the calculated STOIIP. However, when the field was
reevaluated, it was found that using conventional petrophysics but remov-
ing the cutoffs that had previously been applied had the effect of more
than doubling the STOIIP. In many cases it may be true that the effect of
including the nonreservoir shale laminae as net sand roughly compensates
for the oil volume lost from overestimating S w in the sands (caused by the
effect on R t of the shale laminae). However, when the shale laminae are
small compared with the sands, the STOIIP will tend to be underestimated.
Conversely, if the zone is predominantly shale but all treated as being net,
the STOIIP may be overestimated.