
Page 105 - Well Logging and Formation Evaluation
P. 105
Advanced Log Interpretation Techniques 95
0 GR 150 depth (ft) .45 neutron –0.15 0 sigma 50 0 por 0.25
1.95 density 2.95 0 shpor 0.25
X150
X200
X250
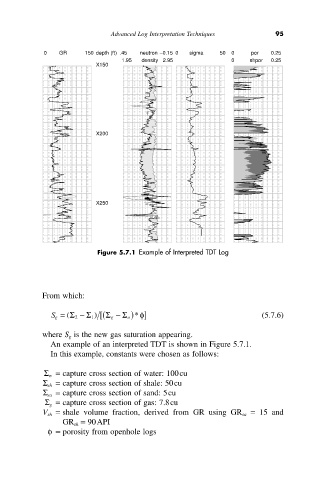
Figure 5.7.1 Example of Interpreted TDT Log
From which:
o )
) ( [ S g - S *f ] (5.7.6)
S g = (S 2 - S 1
where S g is the new gas saturation appearing.
An example of an interpreted TDT is shown in Figure 5.7.1.
In this example, constants were chosen as follows:
S w = capture cross section of water: 100cu
S sh = capture cross section of shale: 50cu
S sa = capture cross section of sand: 5cu
S g = capture cross section of gas: 7.8cu
V sh = shale volume fraction, derived from GR using GR sa = 15 and
GR sh = 90API
f= porosity from openhole logs