
Page 192 - Fluid Power Engineering
P. 192
164 Chapter Eight
Uncertainty Analysis
Wind resource assessment is not complete without uncertainty anal-
ysis. The reason is wind resource assessment provides information
about wind speeds, which is transformed into average annual energy
production (AEP), which is transformed into average revenue of the
project. Uncertainty in wind resource is translated into uncertainty in
AEP, which is translated into uncertainty in revenue. Any financial
analysis of a wind project must consider not just the average revenue,
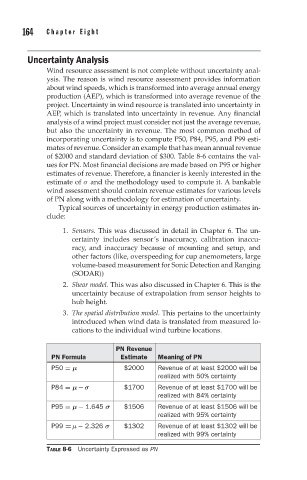
but also the uncertainty in revenue. The most common method of
incorporating uncertainty is to compute P50, P84, P95, and P99 esti-
mates of revenue. Consider an example that has mean annual revenue
of $2000 and standard deviation of $300. Table 8-6 contains the val-
ues for PN. Most financial decisions are made based on P95 or higher
estimates of revenue. Therefore, a financier is keenly interested in the
estimate of σ and the methodology used to compute it. A bankable
wind assessment should contain revenue estimates for various levels
of PN along with a methodology for estimation of uncertainty.
Typical sources of uncertainty in energy production estimates in-
clude:
1. Sensors. This was discussed in detail in Chapter 6. The un-
certainty includes sensor’s inaccuracy, calibration inaccu-
racy, and inaccuracy because of mounting and setup, and
other factors (like, overspeeding for cup anemometers, large
volume-based measurement for Sonic Detection and Ranging
(SODAR))
2. Shear model. This was also discussed in Chapter 6. This is the
uncertainty because of extrapolation from sensor heights to
hub height.
3. The spatial distribution model. This pertains to the uncertainty
introduced when wind data is translated from measured lo-
cations to the individual wind turbine locations.
PN Revenue
PN Formula Estimate Meaning of PN
P50 = μ $2000 Revenue of at least $2000 will be
realized with 50% certainty
P84 = μ − σ $1700 Revenue of at least $1700 will be
realized with 84% certainty
P95 = μ − 1.645 σ $1506 Revenue of at least $1506 will be
realized with 95% certainty
P99 = μ − 2.326 σ $1302 Revenue of at least $1302 will be
realized with 99% certainty
TABLE 8-6 Uncertainty Expressed as PN