
Page 24 - Fluid Power Engineering
P. 24
2 Chapter One 204
250
World Total Installed Capacity, GW 200 39 48 59 74 94 121 159
150
100
31
50
24
0
2001 2002 2003 2004 2005 2006 2007 2008 2009 2010
1
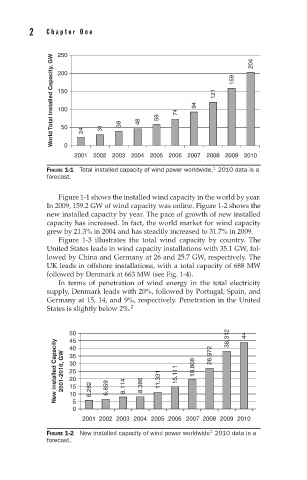
FIGURE 1-1 Total installed capacity of wind power worldwide. 2010 data is a
forecast.
Figure 1-1 shows the installed wind capacity in the world by year.
In 2009, 159.2 GW of wind capacity was online. Figure 1-2 shows the
new installed capacity by year. The pace of growth of new installed
capacity has increased. In fact, the world market for wind capacity
grew by 21.3% in 2004 and has steadily increased to 31.7% in 2009.
Figure 1-3 illustrates the total wind capacity by country. The
United States leads in wind capacity installations with 35.1 GW, fol-
lowed by China and Germany at 26 and 25.7 GW, respectively. The
UK leads in offshore installations, with a total capacity of 688 MW
followed by Denmark at 663 MW (see Fig. 1-4).
In terms of penetration of wind energy in the total electricity
supply, Denmark leads with 20%, followed by Portugal, Spain, and
Germany at 15, 14, and 9%, respectively. Penetration in the United
States is slightly below 2%. 2
50 38.312 44
45
New installed Capacity 2001-2010, GW 35 6.282 6.859 8.114 8.386 11.331 15.111 19.808 26.972
40
30
25
20
15
10
5
0
2001 2002 2003 2004 2005 2006 2007 2008 2009 2010
1
FIGURE 1-2 New installed capacity of wind power worldwide 2010 data is a
forecast.